Track events in real time: Enhance monitoring with proactive log analysis
Preventing issues through proactive log analysis is more advantageous than reacting to problems with troubleshooting when they occur. Logs can act as a powerful source for proactive monitoring, and configuring the right alerts can ensure that you are notified about critical events in advance.
In this blog post, we'll unveil a few suggestions for optimizing log-based alerting to enhance incident management and achieve operational excellence.
Optimize your monitoring strategy in different ways
Our log management solution, Site24x7, uses count-based alerts and trend-based alerts to monitor log data and notify users about specific conditions or patterns within the logs.
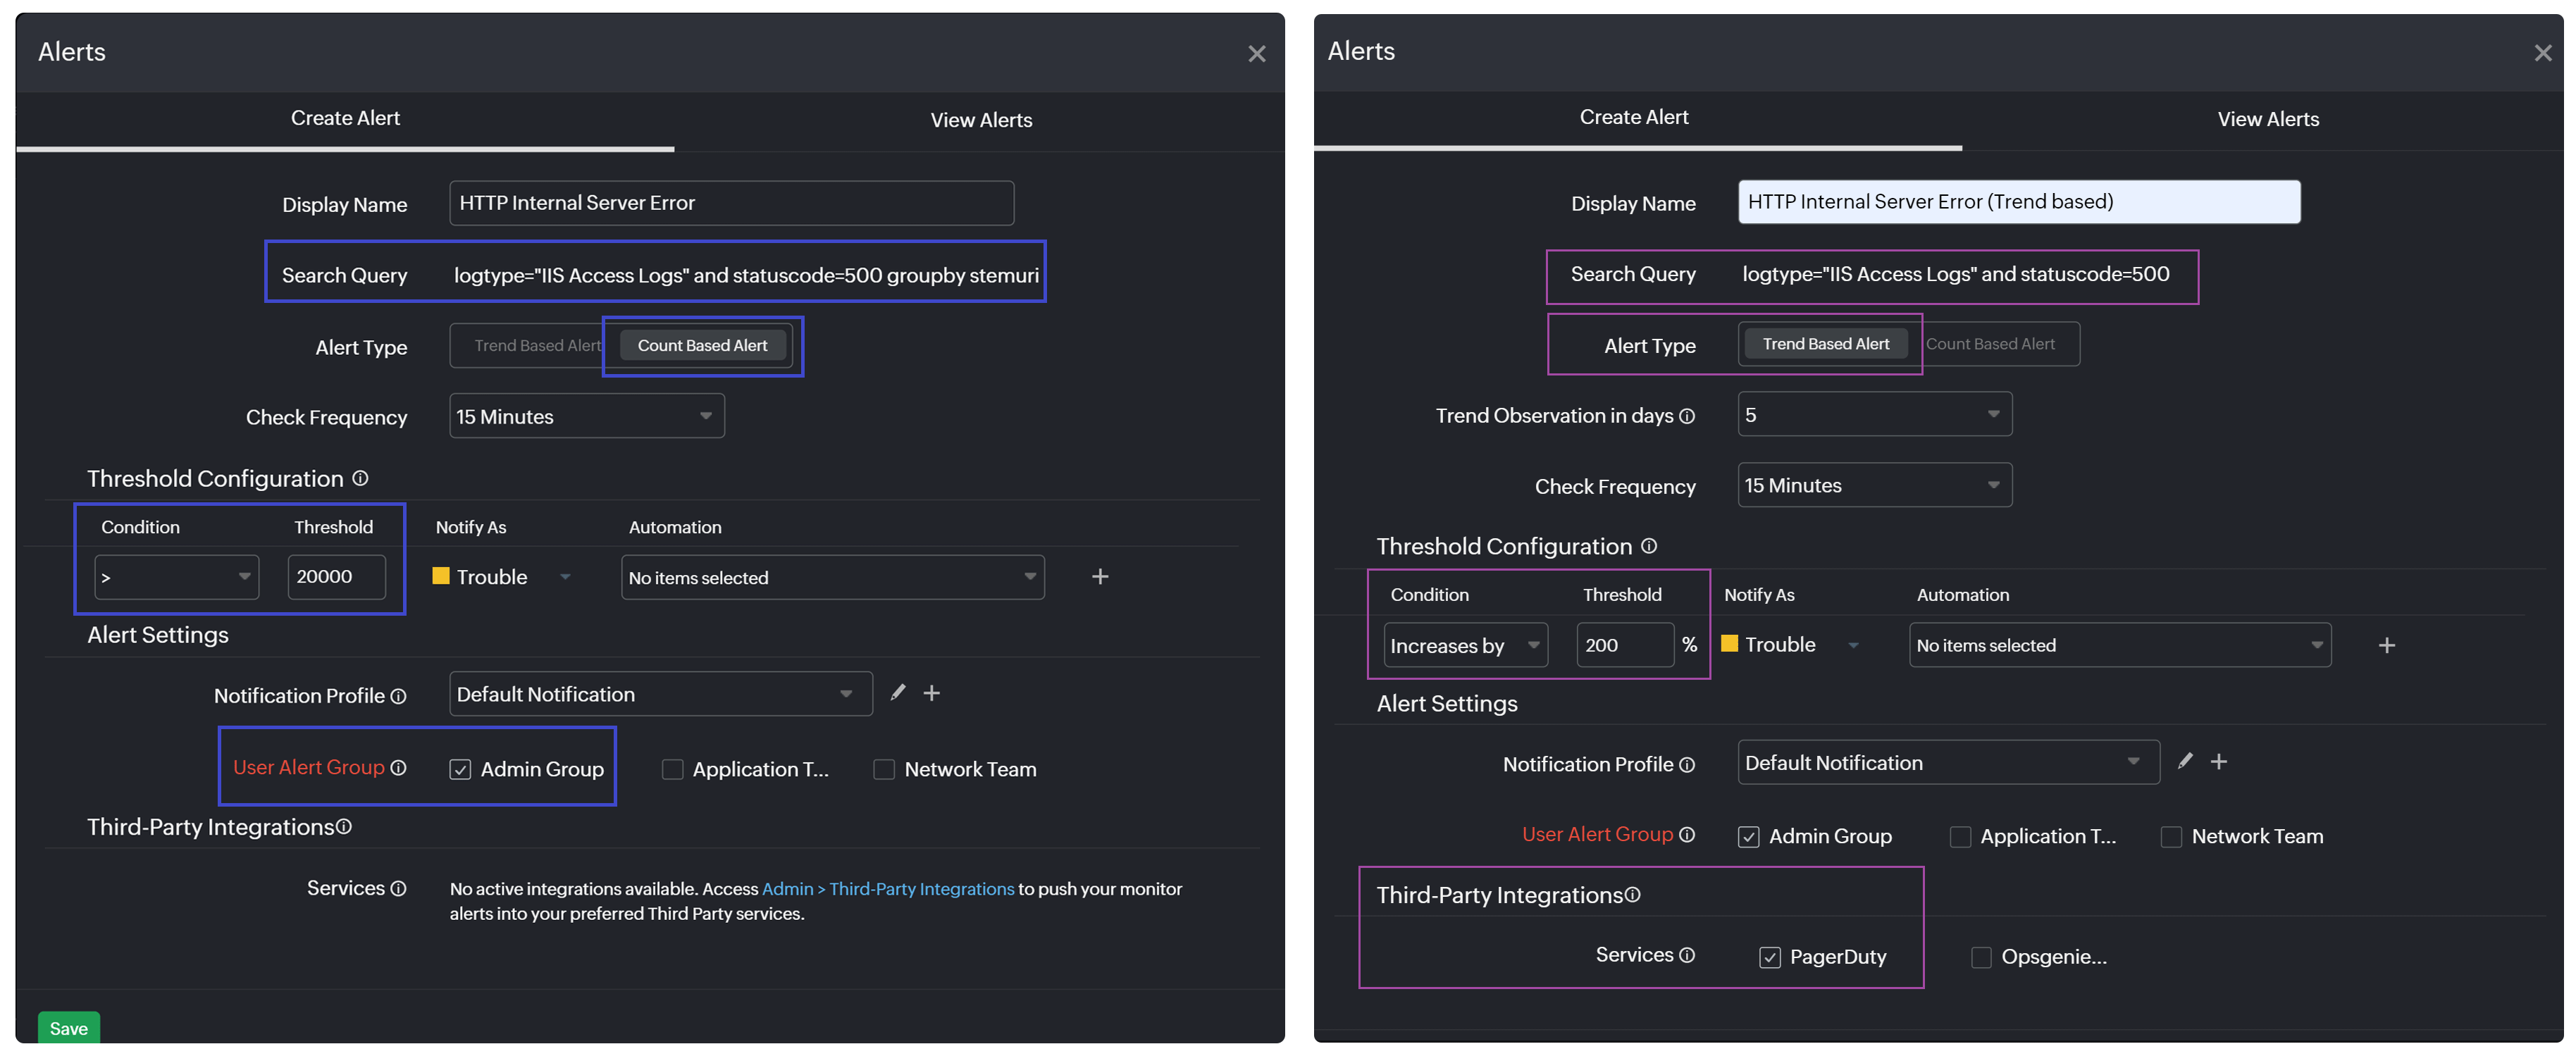
For example, if you want to monitor internal server errors in IIS access logs, you can create a count-based alert for the query logtype="IIS Access Logs" and statuscode=500 groupby stemuri. This alert will trigger when the failure URI exceeds the configured threshold, indicating a significant increase. Additionally, you can set up a trend-based alert for the query logtype="IIS Access Logs" and statuscode=500. This alert will activate when the threshold increases by 200% over a regular failure, indicating a noticeable trend. These alerts can enhance your monitoring approach in different ways.
Count-based alerts help you identify specific URLs experiencing a high volume of errors, while trend-based alerts enable you to monitor broader trends and patterns in error occurrence over time. This multi-faceted approach allows you to proactively manage and address internal server errors, ensuring the reliability and performance of your web services.
With Site24x7, you also have the option to choose a preferred medium for sending alerts, such as using an email account or integrating with various third-party ITSM and collaboration tools like PagerDuty, Opsgenie, and ServiceNow.
Enhance productivity through event-driven IT automation
Automate your IT processes with our IT automation framework, which allows you to auto-resolve log event alerts in seconds without any manual intervention.
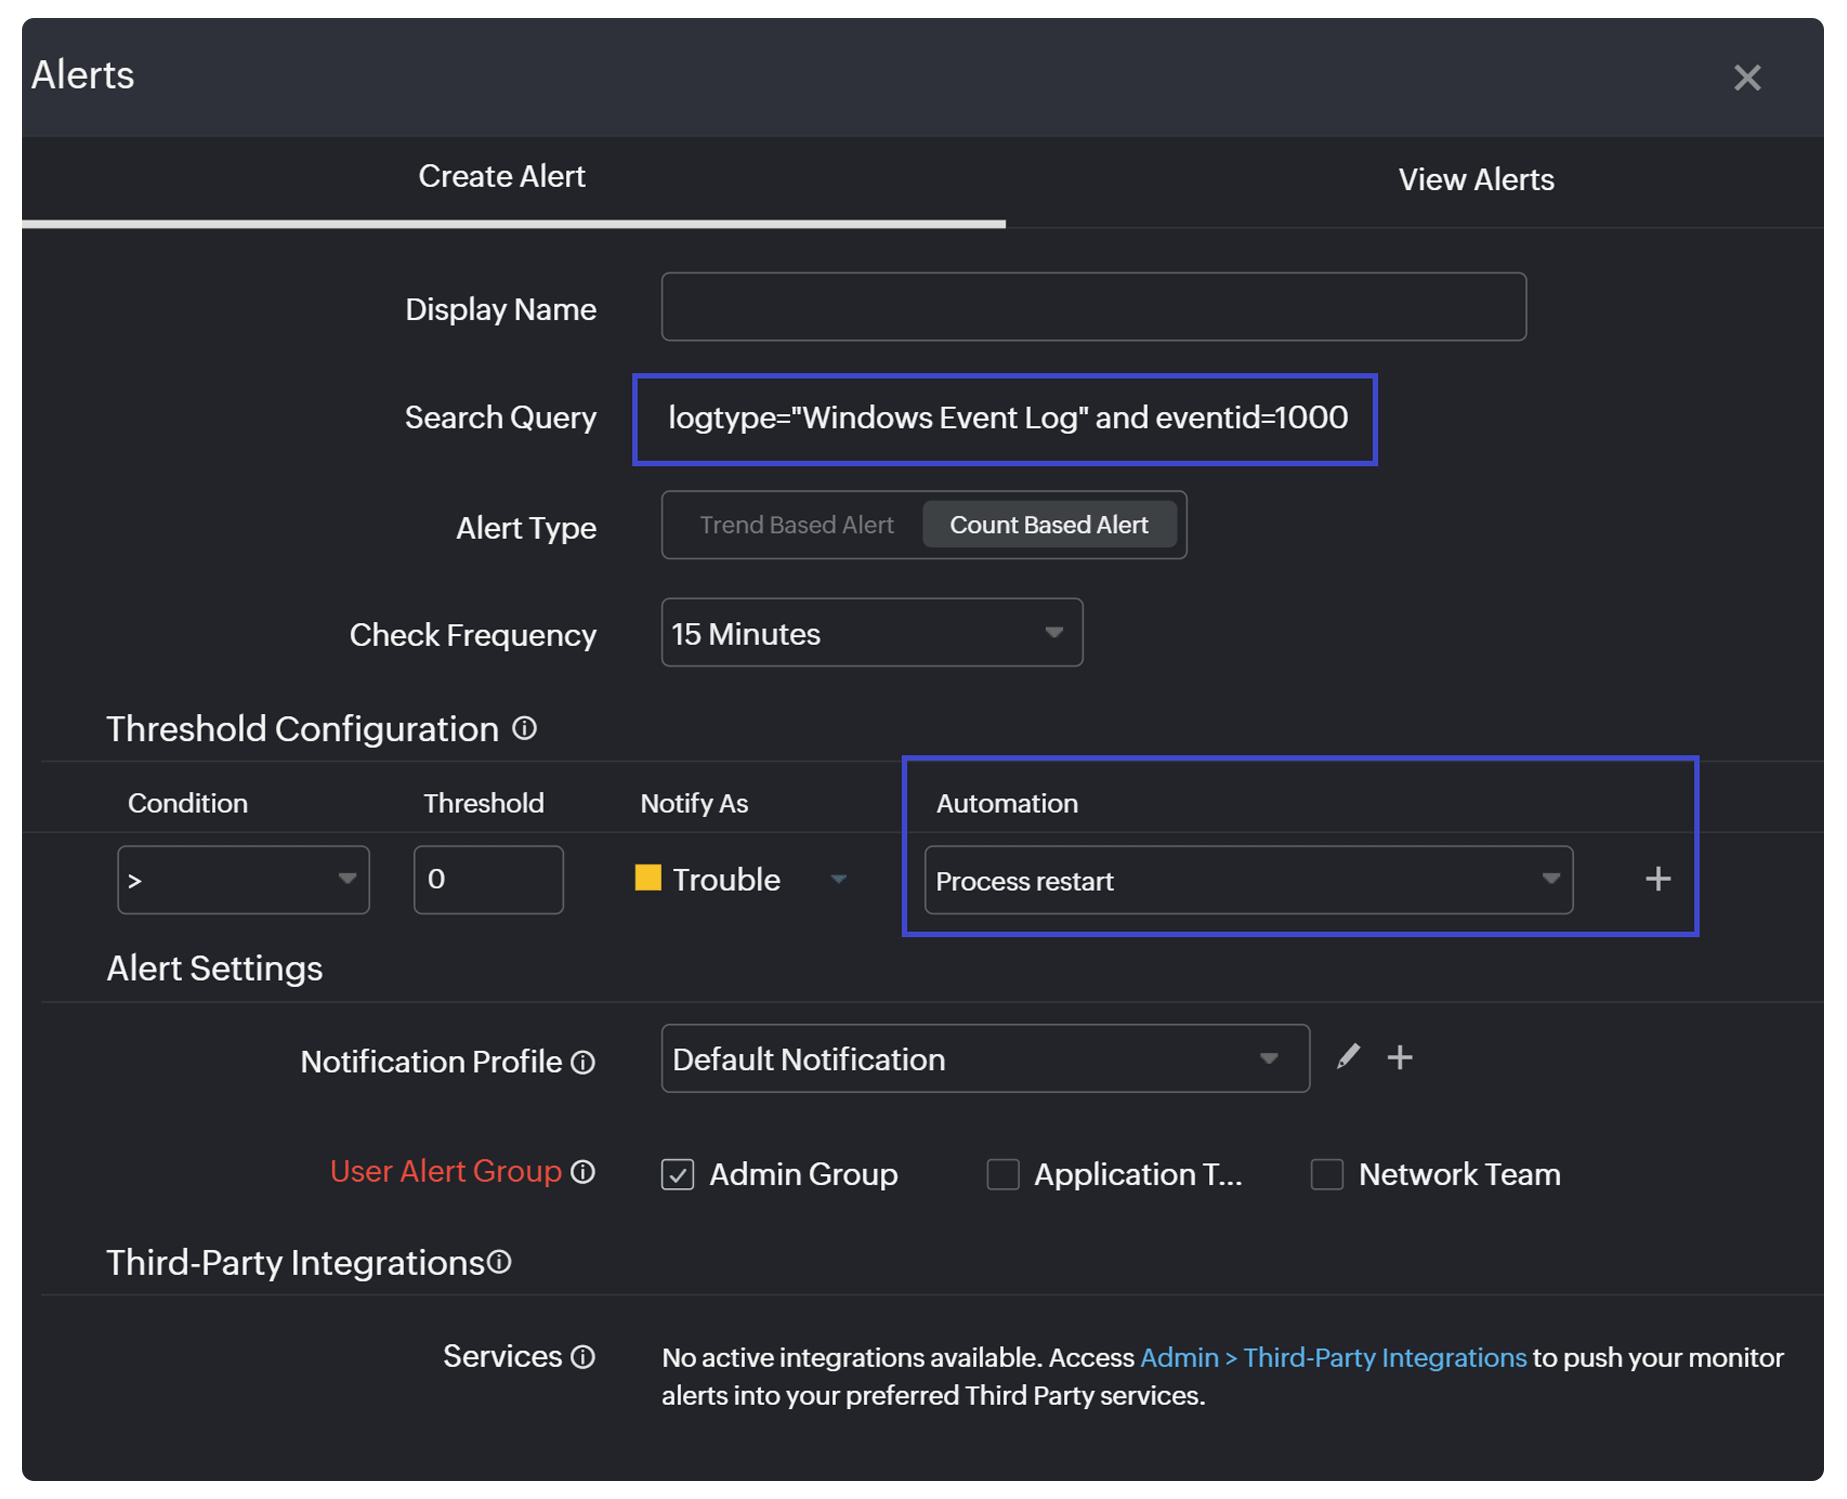
For example, say you want to monitor critical system errors or application crashes in your Windows event logs. In that case, you can create a count-based alert for event ID 1000—logtype="Windows Event Log" and eventid=1000—and enable IT automation to restart the services.
Event ID 1000 indicates system errors or crashes. Setting an alert allows you to respond to such events promptly and prevents any potential impact on application stability and performance. Automating a service restart through IT automation reduces resolution time and restores normal operations more quickly.
Ensure application stability with a proactive approach
Monitor key performance indicators to ensure your application stability and get notified when there is a sudden increase or decrease over a specific period.
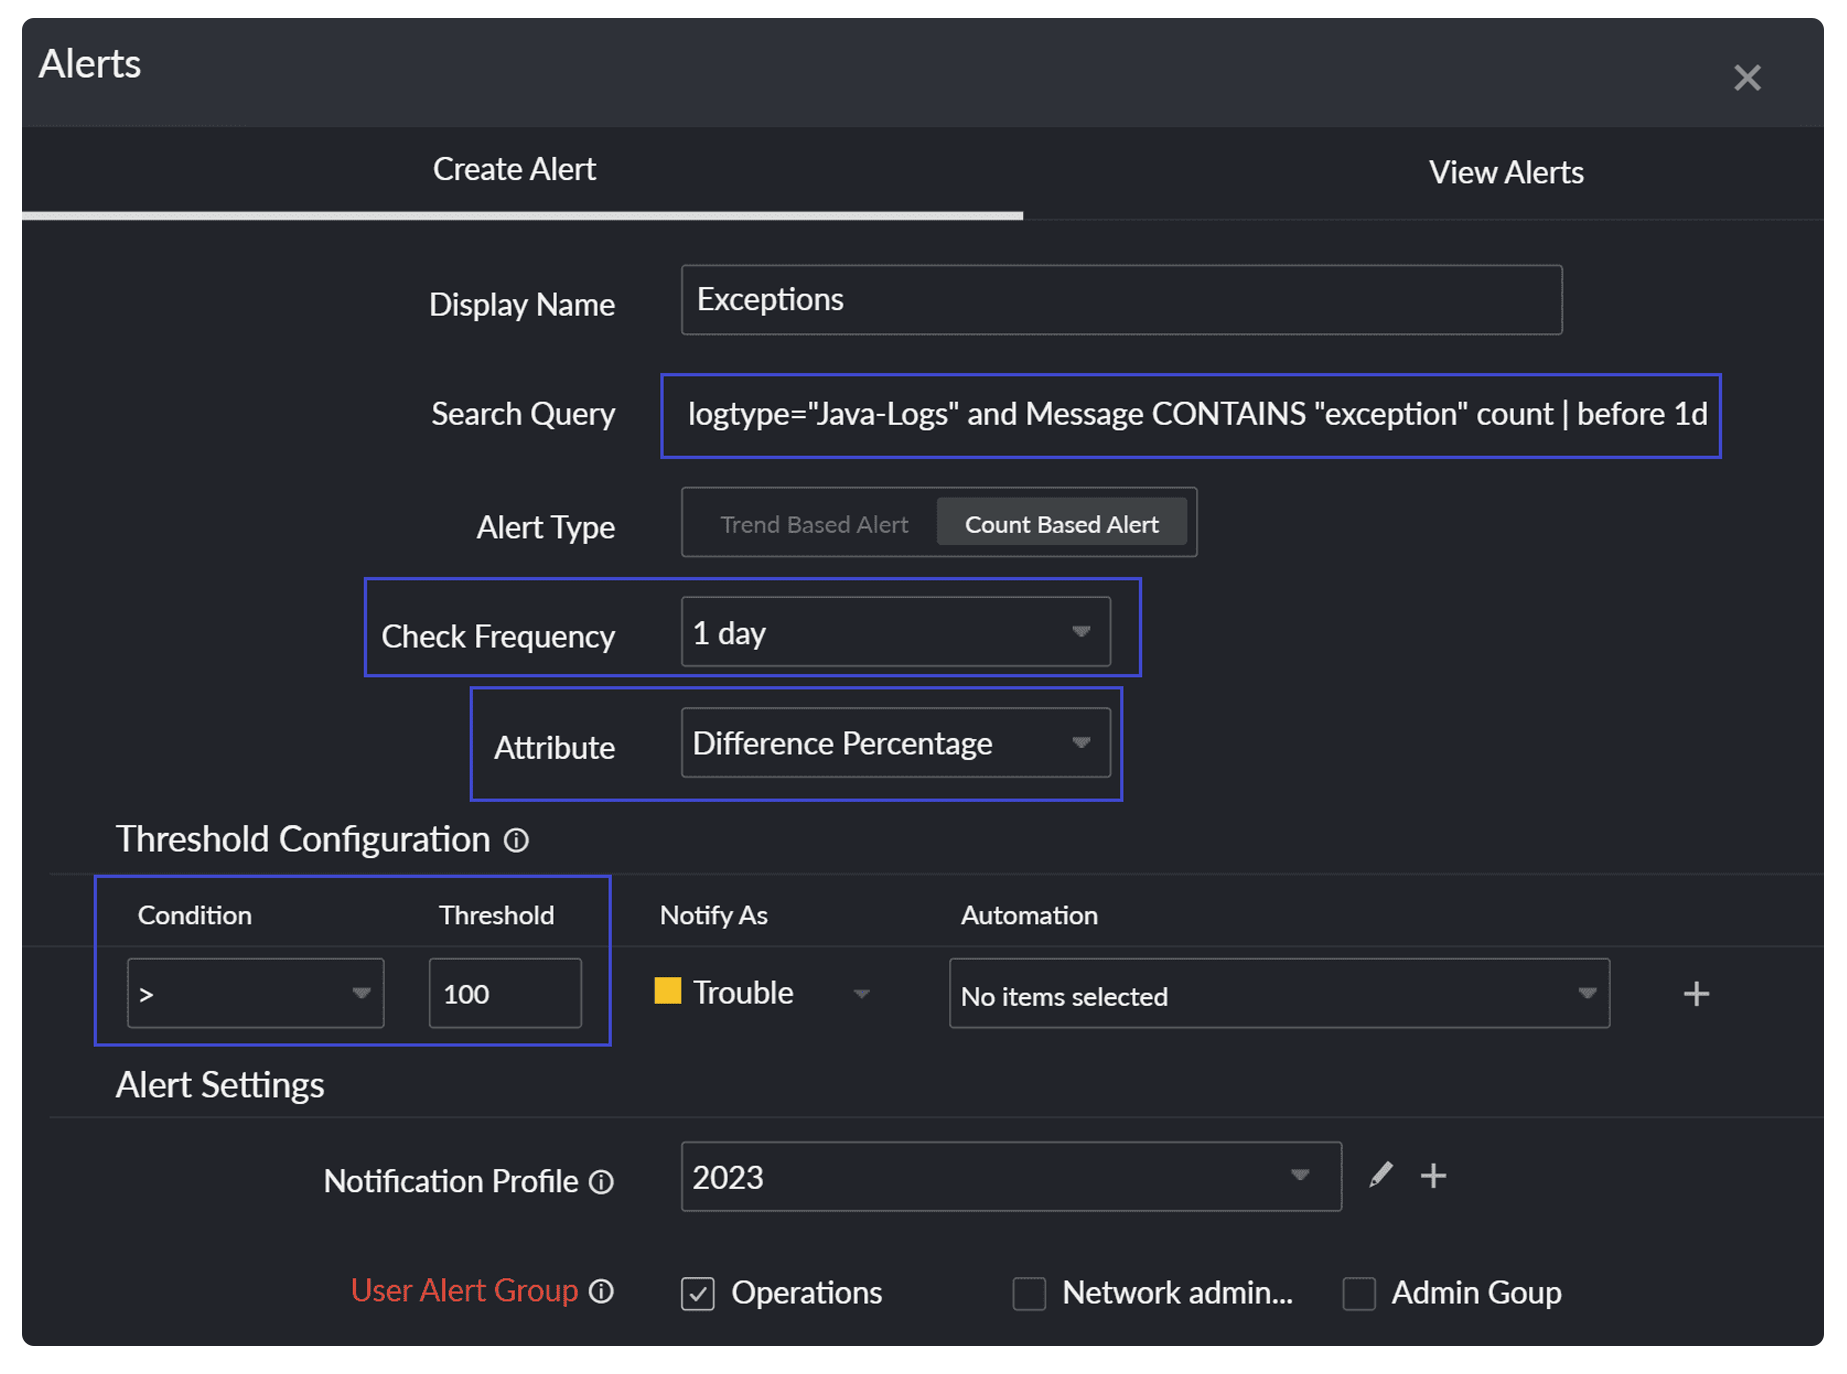
For example, say you want to monitor the frequency of exceptions logged within the Java application logs. In that case, you can create a count-based alert—logtype="Java-Logs" and Message CONTAINS "exception" count | before 1d—to monitor the frequency of exceptions logged within the Java application logs.
If the count of exceptions increases by more than 100% compared to the previous check, users belonging to the specified alert group will be notified. This proactive approach helps identify potential issues or trends in the application's behavior and allows for timely investigation and resolution.
Conclusion
Leveraging real-time event tracking coupled with proactive log analysis offers a robust solution and empowers organizations to maintain a resilient and reliable infrastructure. Improve your application and infrastructure performance with our single-console log management tool, and stay informed with notifications on critical log events in real time. Analyze logs and metrics together on one cloud platform for enhanced observability and actionable insights. Try Site24x7 for log management now!
Comments (0)