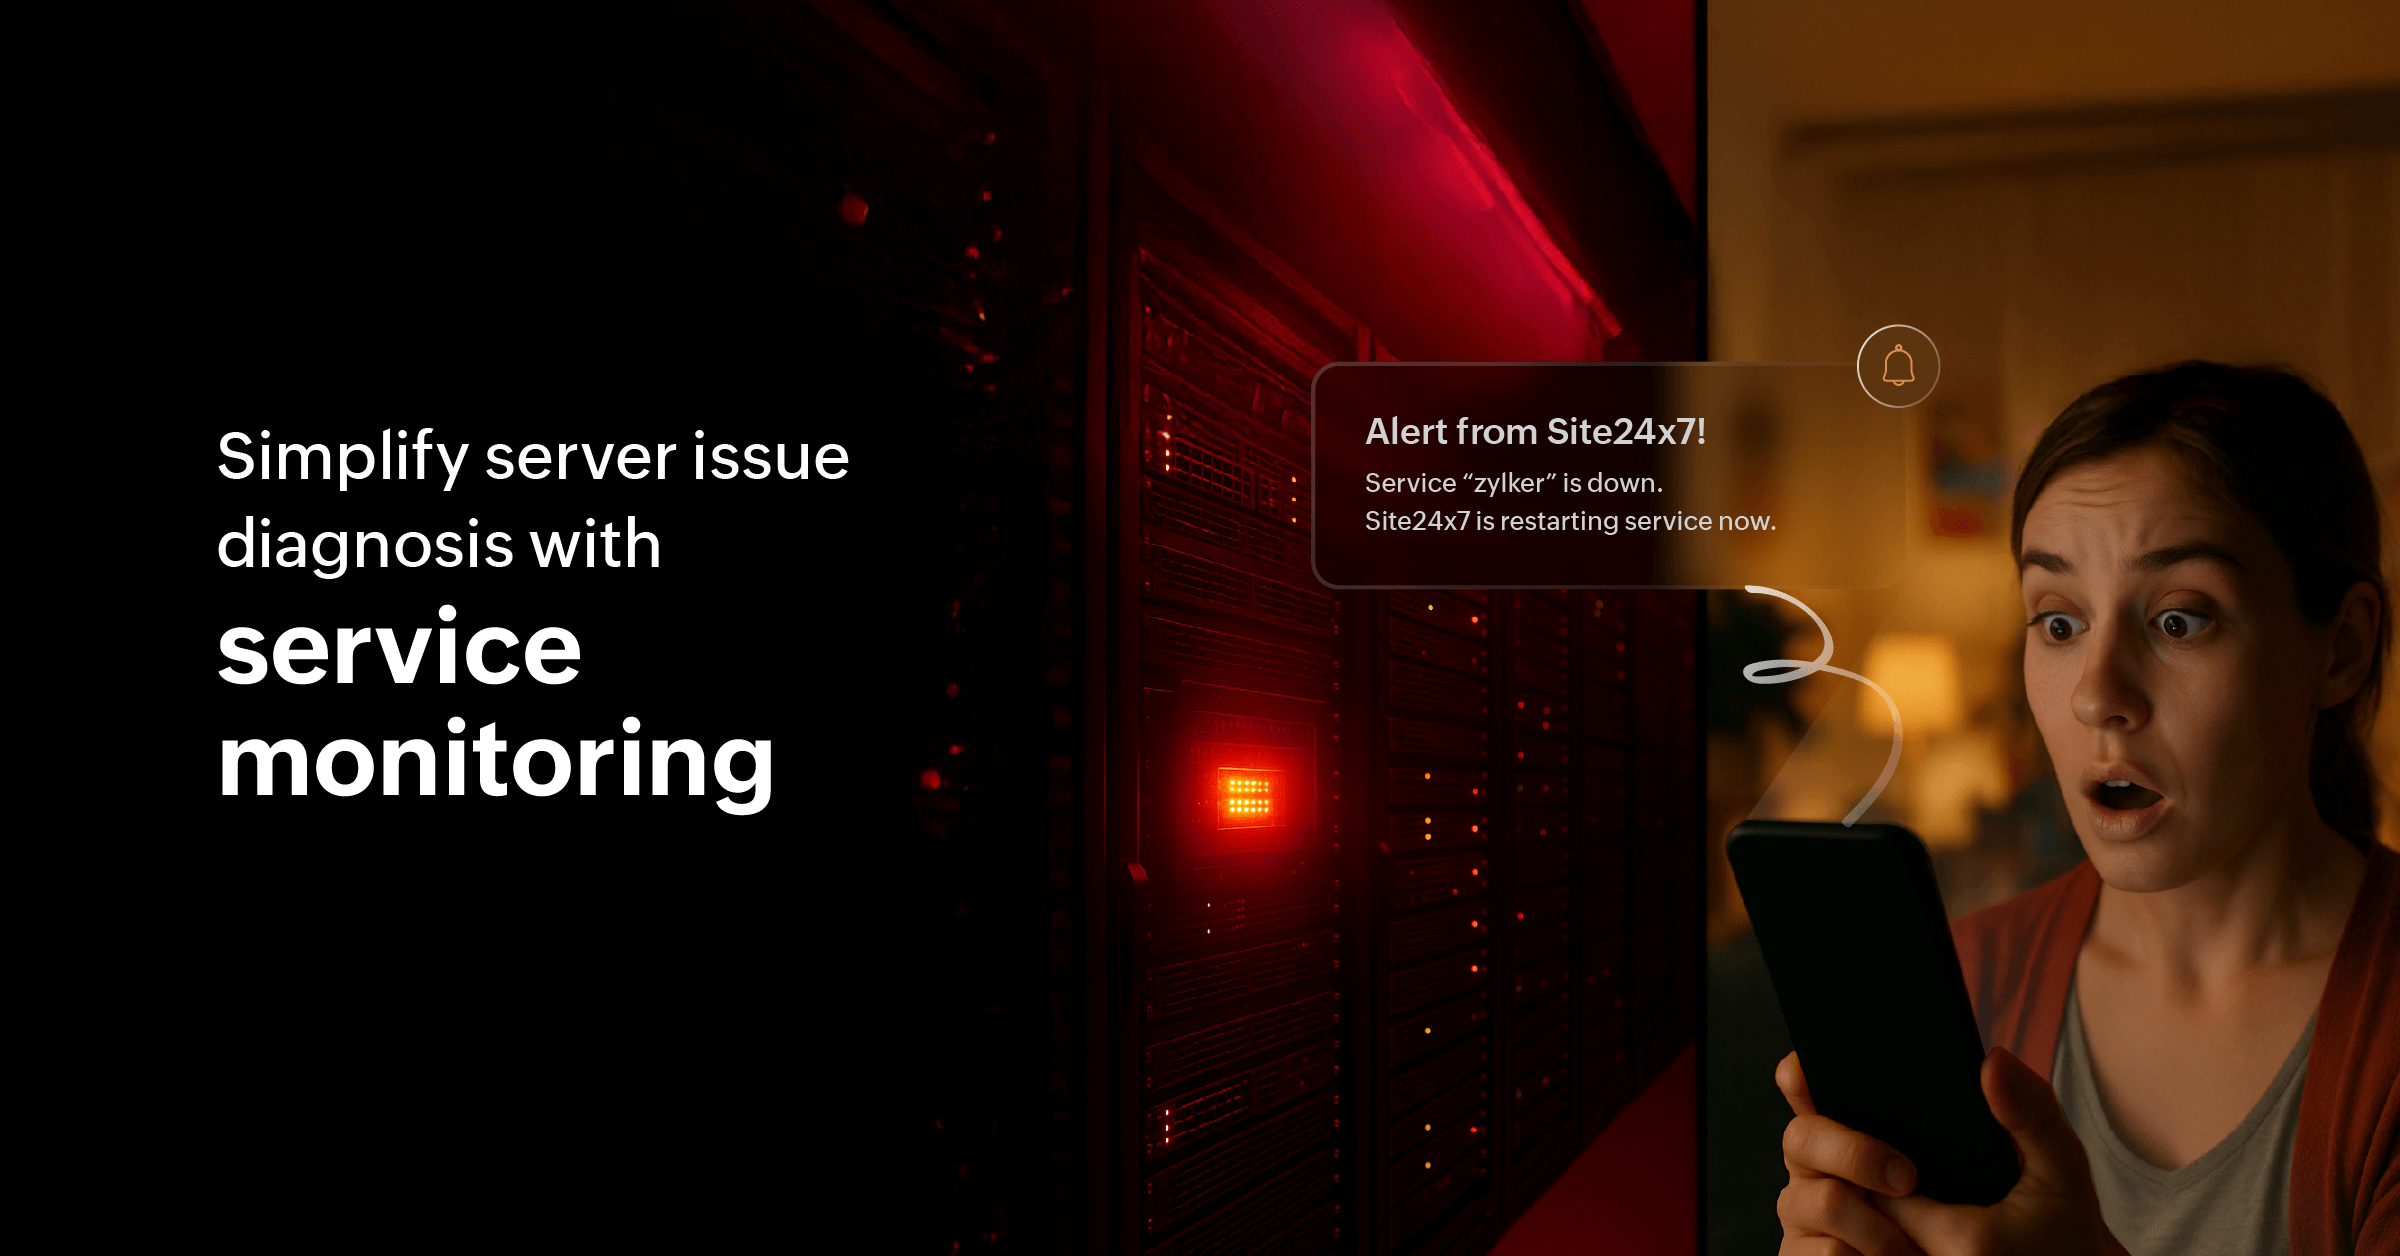
Simplify server issue diagnosis with service monitoring
It's well-known that an alert that just states “the server is down,” is not particularly helpful for your already overworked SysAdmins and SRE teams. Diagnosing why the server went down is their challenge.
The problem is that memory spikes, CPU overload, failing services, or blocked ports can all look the same from a distance. Too often, these issues are responsible for delayed fixes, alert fatigue, and hours wasted switching between tools for data correlation.
Let’s take a closer look at how to fix this.
This would (shouldn't) sound familiar to you
There are several clues that help you detect potential issues:
- A business-critical application hosted on your production server slows down.
- An alert gets triggered for high CPU usage.
- Your team detects the server hosting that particular application and logs in.
- The Directly Responsible Individual (DRI) then checks processes manually, only to find one rogue service consuming most system resources.
- Hours later, you realize the impacted service was not only hogging CPU but also causing dependent services to crash silently in the background.
In traditional monitoring setups, the health indicator of each component of a server sits in its own silo. To diagnose, admins jump between dashboards or command-line investigations. The result? Hours lost while end users face prolonged outages.
Now let’s see how this same story plays out with Site24x7 Service Monitor
With Service Monitor, you move beyond monitoring server health alone. This powerful tool provides a holistic view of server internals by stitching together services, processes, ports, and performance metrics so admins can connect the dots instantly.
Here’s how it helps:
- Start by navigating to the Service Viewer and see all the services running on and running your servers. Then pinpoint the critical ones.
- In a matter of seconds, you see which service is consuming abnormal CPU or memory and how that impacts related processes.
- Understand which services are running, and where service failures ripple across applications.
Instead of hunting through task manager and top commands and their equivalents in each machine, admins receive a single unified view in the Site24x7 dashboard.
The pain points solved
An enterprise with thousands of servers might face a variety of recurring pain points. Here's how Service Viewer helps:
- Identifies the exact service, such as a database query handler or Java process, pushing CPU or memory beyond thresholds.
- Spots mission-critical services like IIS, Apache, or MySQL crashing and auto-triage before end users report downtime.
- Easily traces how one failing process cascades into multiple application errors.
Instead of piecing this information together manually, Service Viewer lays it all out in one place.
How to create a server service monitor
Getting started is simple. All you need is the Site24x7 server monitoring agent installed. Once installed:
- Log in to your Site24x7 account.
- Under Server in the left-navigation menu, click Server Tools, and then navigate to Service Viewer.
Instantly view the list of all services in the selected server, their associated process, their status, start mode and two more interesting features:
- Click + Add to create a service monitor that helps you keep an AI-enabled eye on your critical services.
- Under the Action column, you can either start a stopped service, or stop a running service.
With zero additional setup, your IT infrastructure gains visibility into the exact services that matter most.
Solve more pain points
Fixing an IT problem takes a two-pronged approach: finding the problem and letting the right hands work on it. With Site24x7’s intelligent alarms engine, you can route failures to the appropriate DRIs instead of having to notify the network admin, CTO, or others to take action.
This balance ensures admins act fast without being overwhelmed by system alert noise and alarm fatigue.
Find and fix in parallel
The Service monitor pairs seamlessly with Site24x7’s IT Automation capabilities. For example, if a critical service stops, automatically restart it or if memory usage for a specific process crosses a threshold, kill and restart the process.
This turns the Service monitor into not just a diagnostic dashboard, but also a self-healing mechanism for recurring service-level problems.
Bring observability and more—and then some more
Set it up once, and let Service Viewer power your troubleshooting workflows, so your team can focus more on fixes and less on firefighting.
If you’re already a Site24x7 customer, start exploring the Process and Services tab in your server monitors today. If not, sign up for a personalized demo and let us show you how our comprehensive monitoring suite helps organizations simplify server troubleshooting and strengthen uptime performance.
Comments (0)