How to Setup Site24x7's Real User Monitoring (RUM)
Have you ever wondered if your end-users are truly satisfied with your web applications? Would you like to get accurate insight into end-user experience for better business decisions that will impact your bottom line? ~With Site24x7 Real User Monitoring you can!
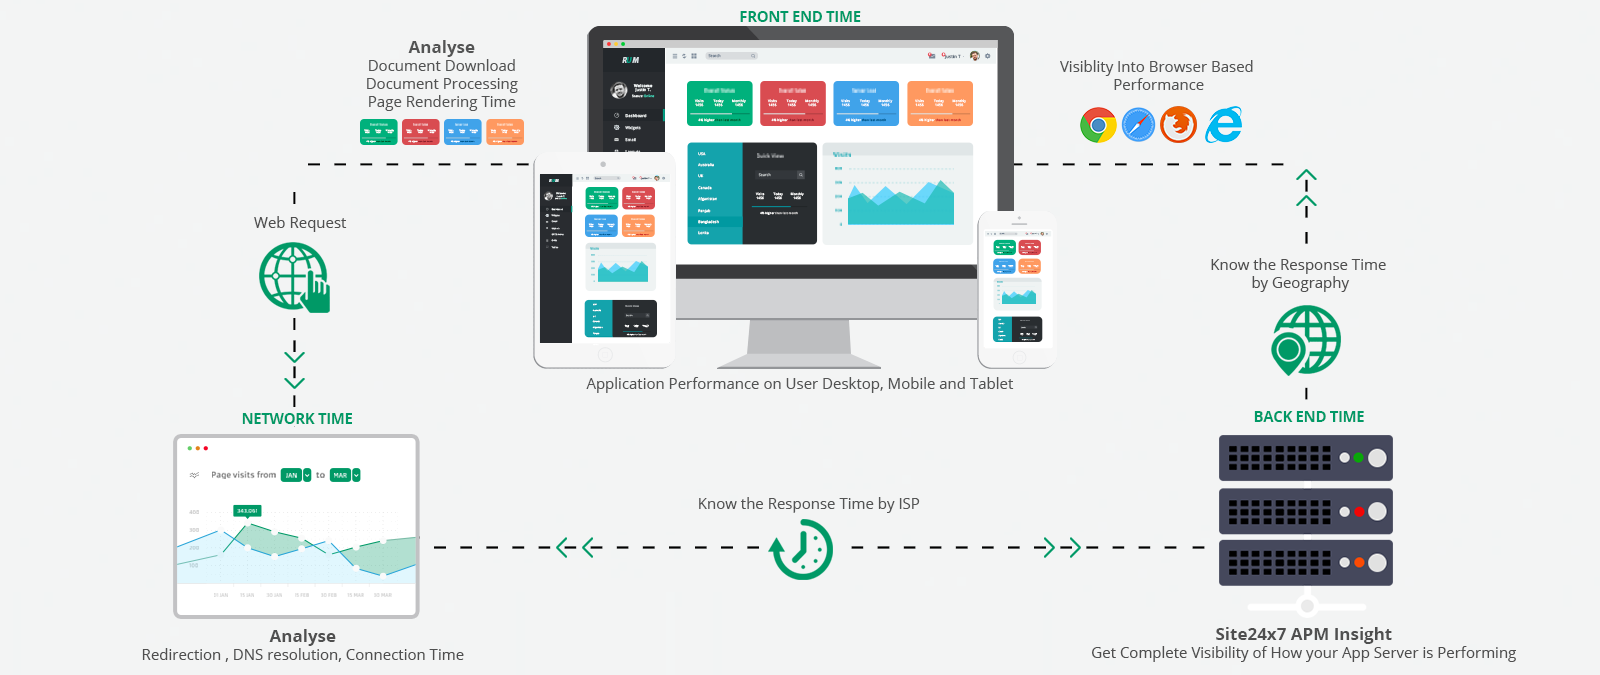
Get ready to gain real-time visibility into end-user experience ( for ALL users, browsers, devices and geographies) and behind-the-scenes performance for your web application.
For example:
[caption id="attachment_3309" align="aligncenter" width="850"]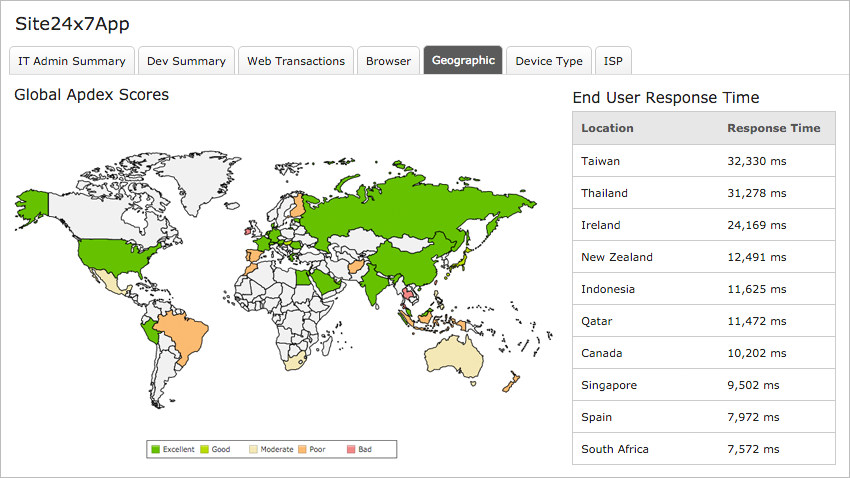 Do you have major geographical response time discrepancies that should be corrected with a Content Delivery Network? In this example if Russia is a key target market for your company, you have a problem because your Web application is 3x slower there![/caption]
[caption id="attachment_3306" align="aligncenter" width="850"] Do you need to tackle Web performance optimization? With Site24x7 RUM you will know if your real users are happy via 3 easy-to-understand levels (Satisfied, Tolerant and Frustrated). Since the best Apdex score you can get is 1, when Apdex starts to fall is time to explore Web performance optimization initial with a cross-functional team.[/caption]
[caption id="attachment_3310" align="aligncenter" width="850"]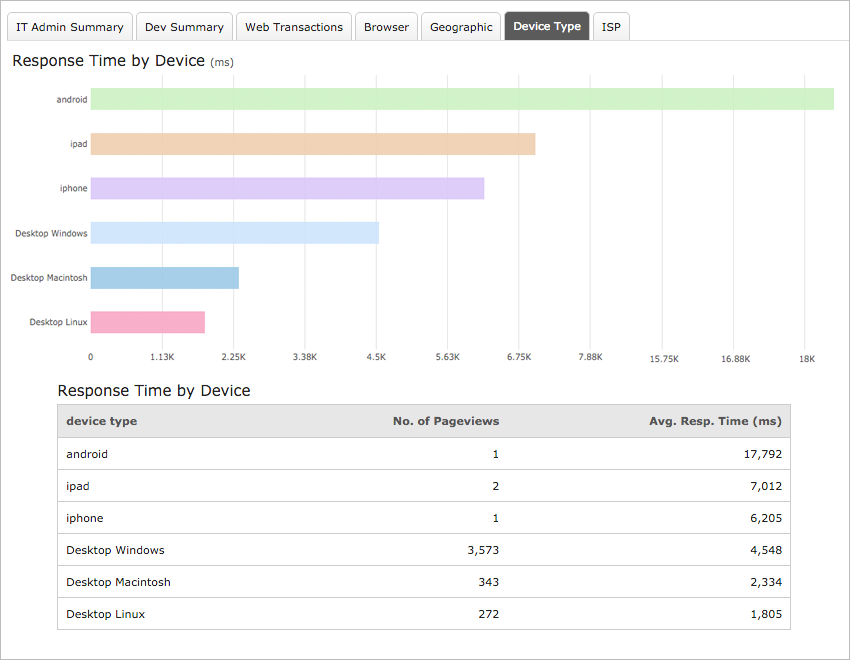 Do you need to roll-back updates to your Website? With Site24x7 RUM you can share with DevOps the impact that new updates have on performance for specific browser (Chrome, Firefox, Safari, Android Browser, Chrome for Android, Opera, IE) or device type. In this case Desktop Linux is faster than Mac or Windows.[/caption]
[caption id="attachment_3312" align="aligncenter" width="850"]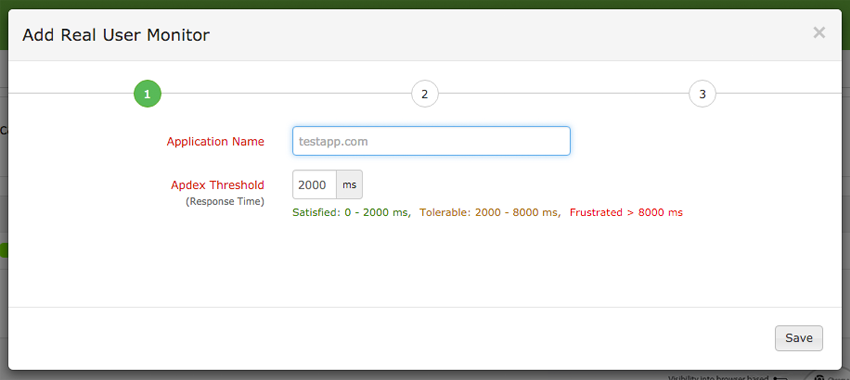 Enter the Website that you want to monitor in real-time (this is needed to generate a custom JavaScript snippet). This is where you enter the response time threshold that will be used to compute your Apdex score (to measure real user satisfaction with your~web sites).
TIP: Visit Site24x7 Benchmarks to see web performances for your industry peers and setup a good threshold for your target Web application. Remember, your end-users are impatient, and your application should perform top-notch.[/caption]
[caption id="attachment_3307" align="aligncenter" width="850"]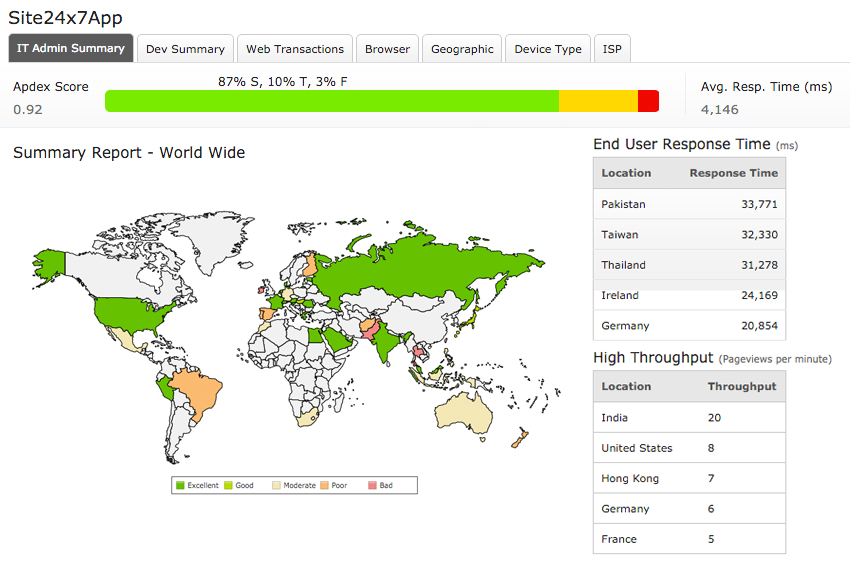 See at a glance top and under-performing regions, traffic volume, overall user satisfaction or where most of the time is spent – in this case on the front-end.[/caption]
[caption id="attachment_3311" align="aligncenter" width="850"]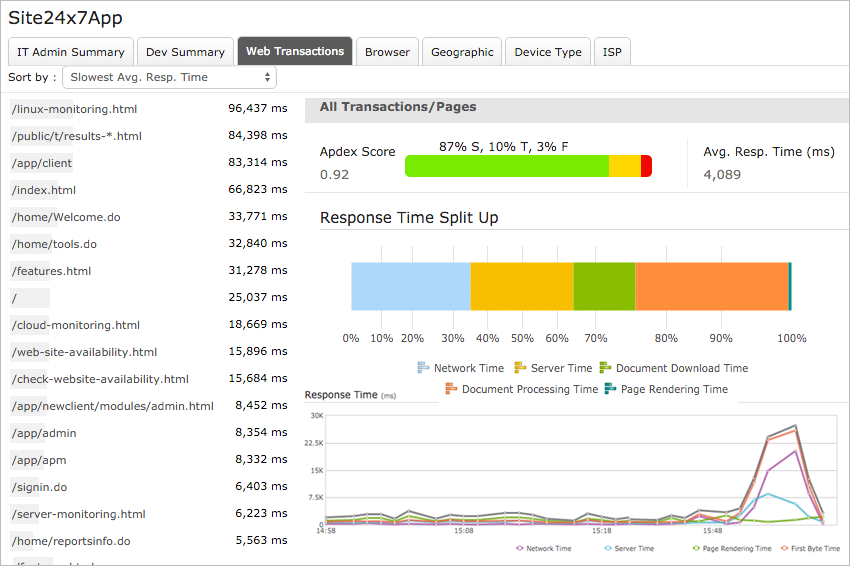 Apdex Score is too low – 0.69! Sort by “Slowest Average Response Time” so you can immediately identify slower transactions.~Check-out your response time split-up chart to locate bottlenecks. If you hover over you will see: network time-43%, server time-29%, document download time-6%, document processing time-22%, and page rendering time- 0.27%. Since network and server time are the highest, check your Site24x7 On premise pollers to analyze a potential server overload problem or potential network bandwidth issue -- all the information that you need is on the same console. Document processing time is also high, so you may want to review your DOM as well.[/caption]
Ready to take your~web monitoring to the next level and add Site24x7 Real User Monitoring to your IT monitoring arsenal? Sign-up for a free Site24x7 trial account!
Want to share your Web monitoring strategy with your IT peers? Visit our Site24x7 community forums! Happy Monitoring with Site24x7!
What if I want to monitor my website that requires login? How should I configure login credentials?
Hi Varkan,
In RUM, you must insert the script in the header and footer of all pages, in the common JS file, or in the initial JS file for single-page applications (SPA). We monitor data based on real-user interactions. Hence, we do not require login credentials for monitoring, and performance tracking happens when a real user logs in to your portal.
Regards,
Deva Priya