Check the health and availability of your Linux servers for optimal performance with Site24x7's Linux monitoring tool.
Effective Linux monitoring starts with the command line. System administrators rely on a core set of commands to track CPU and memory usage, disk I/O operations, network activity, port configuration, and much more. Knowing which command to reach for—and when—is what separates reactive troubleshooting from proactive performance management.
In this article, we cover ten essential Linux monitoring commands that help you observe system health, identify and kill resource-hungry processes, and diagnose bottlenecks before they affect end users. Each section includes syntax examples and practical options so you can start using these tools immediately.
Whether you manage a single development machine or a fleet of production servers, mastering these commands gives you the foundation for reliable Linux monitoring at any scale.
top is one of the most frequently used commands by system administrators. At a very high level, the command shows the system uptime, CPU usage, number of threads, memory usage (total, used, free, etc.), a list of running processes, and much more. Figure 1 shows a screenshot of the top user interface taken on Ubuntu 18.04.
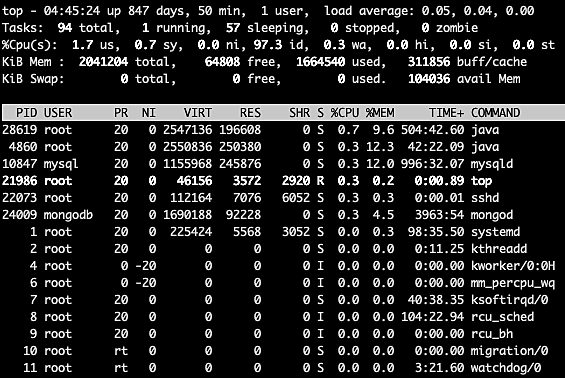 Fig. 1: top UI on Ubuntu
Figure 1 shows that there’s a lot of information here, and a lot of options to filter the task list, kill processes, sort the list, and more. For example, we can sort the task list by the %CPU or %MEM columns to easily find out which processes are consuming the most CPU or most memory. Use these commands to sort tasks by memory or CPU percentage:
top -o +%MEM
top -o +%CPU
Figure 2 shows the processes sorted by the percentage of memory used in descending order.
 Fig. 2: Task area sorted by percentage of memory used
Sorting by CPU usage or memory consumption lets us identify processes that could be causing performance issues. We can then easily kill those processes from the same top user interface.
htop is an interactive process viewer that has become the go-to alternative to top for everyday Linux monitoring. It provides a color-coded, real-time display of CPU cores, memory usage, and running processes—all in a terminal interface that supports mouse interaction and horizontal/vertical scrolling.
Unlike top, htop shows individual CPU core utilization as color-coded bar graphs at the top of the screen, making it easy to spot uneven load distribution across cores. The process list is fully scrollable, and you can search, filter, sort, and manage processes without memorizing obscure keyboard shortcuts.
To launch htop, simply run:
htop
Key features that make htop valuable for Linux monitoring include:
F5 to toggle a tree view that shows parent-child process relationships, which helps trace process hierarchies during debugging.F4 to filter the process list by name, quickly narrowing down to the services you care about.F6 to choose a column to sort by—CPU%, MEM%, PID, user, and more.F9 to send a signal (SIGTERM, SIGKILL, etc.) without leaving the interface.htop is available in the default package repositories of most Linux distributions. Install it with apt install htop on Debian/Ubuntu or yum install htop on RHEL/CentOS.
vmstat tells us everything we need to know about virtual memory. The system starts using virtual memory when it runs out of physical memory. Therefore, to start with, virtual memory will always be zero. Along with virtual memory stats, vmstat gives us a lot more information about system processes, interrupts, block I/O operations, disks, paging, CPU scheduling, and more.
Figure 3 shows the output of vmstat without any options passed. The command is:
vmstat
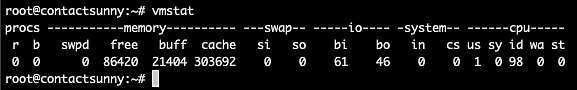 Fig. 3: vmstat output
As you can see, it's not as dense as the top UI. But with just a few options, we can still get all the information we need. For example, passing the option a gives us the active and inactive memory info, as shown in figure 4. The command is:
vmstat -a
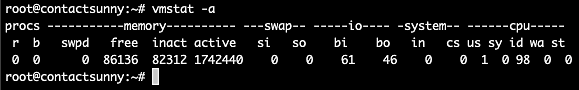 Fig. 4: vmstat -a output
Passing the option s will give us all the information we need about CPU scheduling, as seen from figure 5. The command is:
vmstat -s
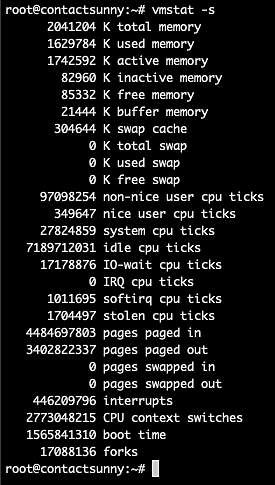 Fig. 5: vmstat -s output
When you need a quick snapshot of memory usage without the full process list that top or htop provides, free is the fastest option. It displays the total, used, free, shared, buffer/cache, and available memory on the system in a single concise table.
Run the command with the -h flag for human-readable output:
free -h
The output shows two rows—one for physical memory (Mem) and one for swap. Key columns to watch during Linux monitoring are:
For continuous monitoring, pass an interval in seconds to refresh the output automatically:
free -h -s 5
This refreshes the memory statistics every five seconds, which is useful when watching memory consumption during a deployment or load test.
In Linux, everything depends on files. For example, the network adapters—and even any USB accessory that we plug in—are all controlled using files. So, any issues with hardware, or even software on a Linux machine has to be debugged using files. lsof (or list of open files) is a handy command to quickly see the list of open files and associated processes.
Figure 6 shows a truncated list of the lsof command output. This table gives us a lot of information, including the command used to run the process that owns the file, the PID, the user who owns the process, the type and size of the file, and more.
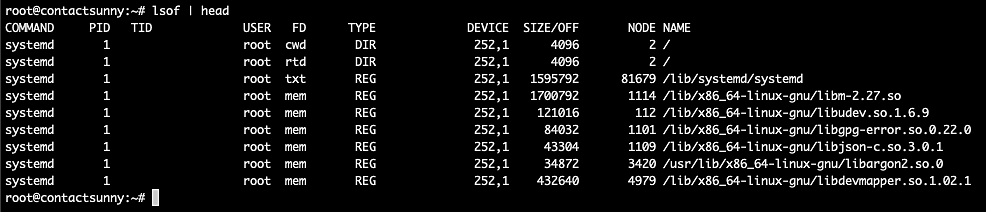 Fig. 6: lsof output
We can use various options with the command to filter files for a particular user, or by files used by a certain port, and so on. These include:
lsof -u rootlsof -i TCP:22Figure 7 shows the list of files opened and owned by the user root.
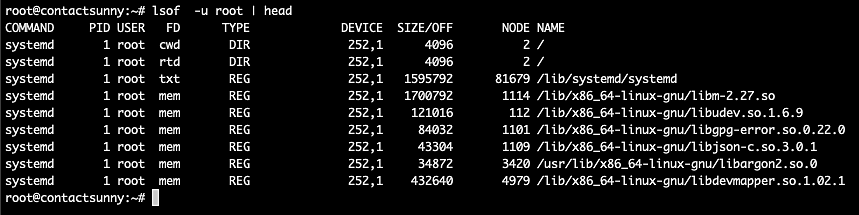 Fig. 7: lsof with user filter
To debug network issues, or to check traffic of any specific app or service on machines, use the command, tcpdump. Figure 8 shows a screenshot of the command’s output.
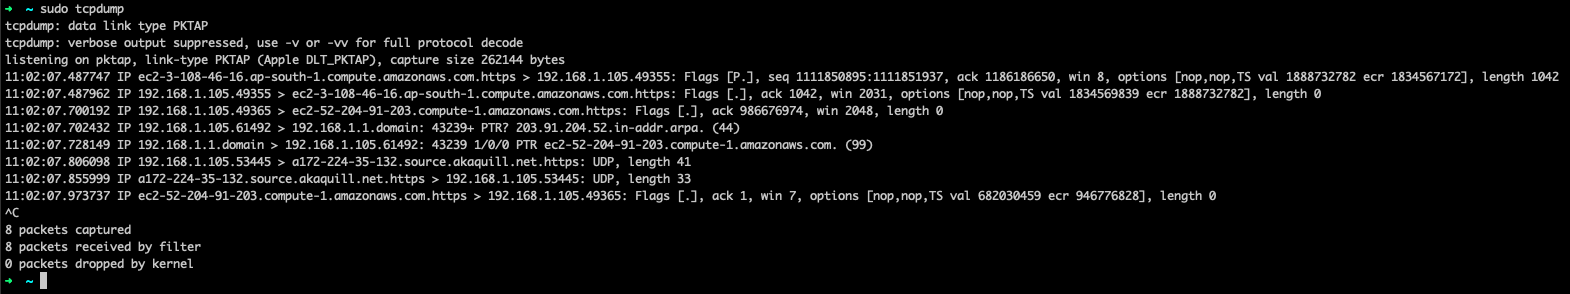 Fig. 8: tcpdump output
As evident from the screenshot, tcpdump provides source IP, destination IP, type of protocol used, amount of bytes transferred, and more. This information is useful when trying to trace a network call or check for unusual network activity.
This command also comes in handy to check if a package or service is making calls to unauthorized hosts or IP addresses. If so, it also checks whether any unauthorized sensitive data is being shared that shouldn’t be, or see if any extra packages are being downloaded that could result in security risks.
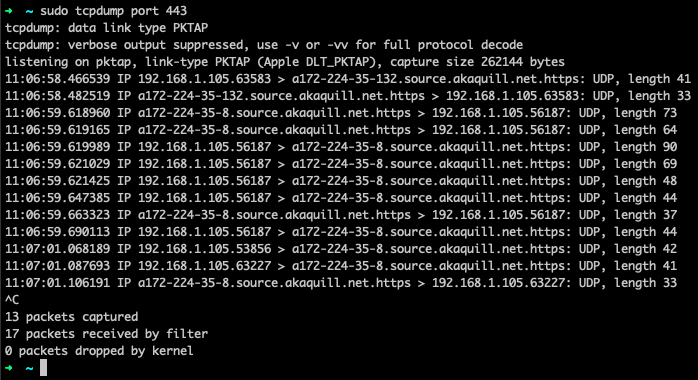 Fig. 9: tcpdump for port 443
net-tools package. The recommended replacement is ss (socket statistics), part of the actively maintained iproute2 suite. We cover netstat here because it remains widely referenced in documentation and legacy systems, but we recommend adopting ss for new workflows.
netstat is a command used to identify open ports, connections to external IP addresses, and the connection status. Figure 10 shows a screenshot of the output of the command.
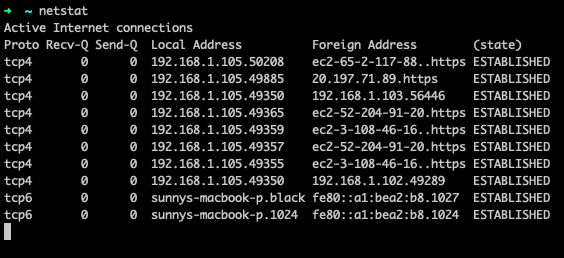 Fig. 10: netstat output
The command provides the protocol used, the local and foreign IP addresses, and also the state of the connection. This helps us find out if a process has all of its ports open, and if they’re being used or not. This can help debug many network problems.
This command also helps debug potential network security issues. There have been many reported instances of security breaches where a network port has been made open on the public internet, leading to an attack. So, whenever we install or deploy a new service, we need to ensure there are no unnecessarily open ports that might result in security risks.
Using netstat, we can also check the network routing table. The option to do so is nr, as illustrated in figure 11.
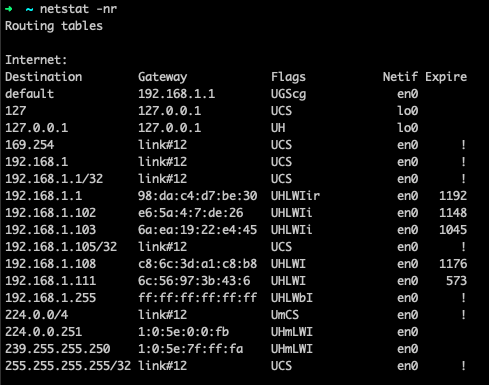 Fig. 11: netstat -nr output
The ss command provides the same functionality as netstat but is significantly faster, especially on systems with thousands of connections. It reads directly from kernel netlink sockets rather than parsing /proc files, which makes it more efficient for Linux monitoring on busy production servers.
Common ss equivalents for the netstat commands shown above:
ss -tunaplss -tlnpss -sThe ss output format includes state, receive/send queue sizes, local and peer addresses, and the process using each socket—providing everything you relied on netstat for, with better performance.
As we’ve already mentioned, everything in a Linux computer is controlled using files. These files are written to the disks attached to the computer. Whenever a process runs, along with CPU and memory, the process also consumes disk bandwidth. In other words, every process performs a number of I/O (input/output) operations every second. And much like other resources, there's a limit to this bandwidth.
iostat is used to monitor such I/O activity on all disks and partitions on a computer. It also provides the CPU utilization for such operations. Using iostat , we can decide if we need to modify system configuration to allow for better or balanced I/O operations. Figure 12 shows the output of iostat on an Ubuntu 18.04 computer.
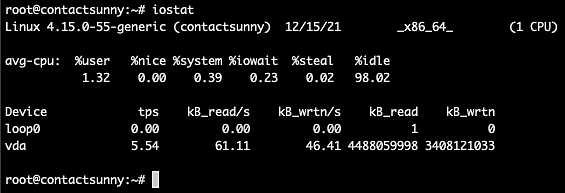 Fig. 12: iostat output
As you can see, the first section of the output is the average CPU usage divided into sections, including userspace, system space, CPU steal, CPU idle, and I/O wait. The %iowait column tells us if the CPU is wasting a lot of time waiting for I/O operations to complete. A high number here would indicate that the I/O is slow, or is being held up in some other process.
The next section lists all the devices attached to the computer, and the corresponding TPS (transfers per second), kilobytes read and write numbers, and much more. These numbers will tell us if further tuning is required to improve I/O performance.
Just as we would use top for monitoring processes, we can use iotop for monitoring all threads that are performing I/O operations and the bandwidth they consume.
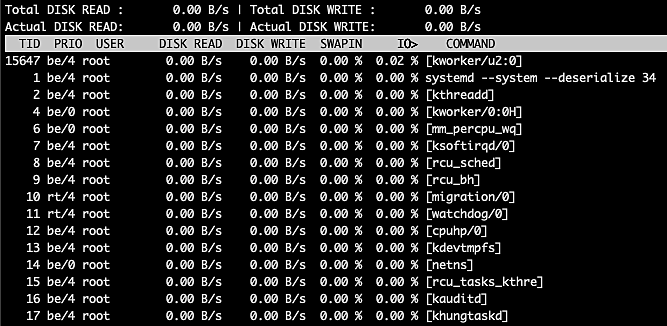 Fig. 13: iotop output
The top left section of this table gives us the total and actual disk read, while the top right section gives the total and actual disk writes. Under these sections, we have a list of threads running on the computer along with the thread ID (TID), the priority of the thread, the owner (user) of the thread, disk read and write bandwidth, percentage of time spent on swap in, percentage of time spent on I/O wait, as well as the command for the thread.
On the other hand, you will also notice that not all these threads perform I/O operations. To filter the list to show only such threads, use the option o or only, as shown below:
iotop -o
or
iotop --only
Figure 14 below shows the output of these commands.
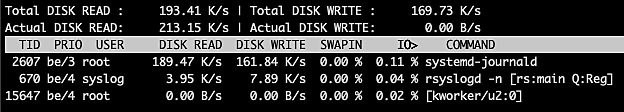 Fig. 14: iotop -o output
This command helps us to see the list of threads that take up too much of the I/O bandwidth and cause other threads to wait on I/O, thereby halting other processes or users.
While most Linux monitoring commands show a real-time snapshot that disappears once you close the terminal, atop fills a critical gap by recording system activity to log files for later review. It captures CPU, memory, disk I/O, network, and per-process resource consumption at configurable intervals, storing this data in compressed binary logs.
To view real-time system activity, run:
atop
To review historical data from a previously recorded log, use the -r flag with the log file path:
atop -r /var/log/atop/atop_20260603
Once you open a historical log, use the t key to step forward through recorded intervals and T to step backward. This is especially useful for post-incident investigation—when a performance spike happened overnight, you can replay system activity at each interval to identify exactly which process or resource was responsible.
Key features that make atop valuable for Linux monitoring:
d for per-disk statistics or n for per-interface network stats.Install atop with apt install atop on Debian/Ubuntu or yum install atop on RHEL/CentOS. Once installed, the atop service starts automatically and begins recording system snapshots.
These ten Linux monitoring commands give system administrators the visibility they need to diagnose performance issues, track resource consumption, and maintain healthy servers. From real-time process monitoring with top and htop to historical analysis with atop, each command serves a distinct purpose in your troubleshooting toolkit.
Knowing the syntax and options is only part of the equation—you also need to know which command to reach for in each scenario. Use free for a quick memory check, iotop when disk I/O is the suspect, ss for network connections on modern systems, and atop when you need to investigate an incident that already happened.
For production environments where manual command-line monitoring is not practical around the clock, consider pairing these tools with an automated Linux monitoring solution like Site24x7 that provides continuous data collection, historical trends, and alerting.
While `top` gives real-time snapshots, Site24x7 provides historical data, trend analysis, and automated alerting. This means you don't have to watch the screen 24/7 and can focus on other critical tasks.
Yes, with Site24x7 IT Automation, you can automatically execute scripts or commands. For example, you can restart a service in response to specific alerts. This provides automated remediation without manual intervention.
Yes, Site24x7 provides a 'Top Processes by CPU' view. This allows you to instantly identify which applications are draining system resources. You can also set up custom thresholds or use dynamic thresholds (AI-based anomaly detection) to get alerts when CPU consumption exceeds expected levels.
htop provides an interactive, color-coded interface with mouse support, per-core CPU visualization, and the ability to scroll through the full process list. Unlike top, htop lets you search, filter, and manage processes without memorizing keyboard shortcuts, making it the preferred choice for daily Linux monitoring tasks.
netstat is part of the deprecated net-tools package. Modern Linux distributions recommend ss (socket statistics) as its replacement. ss is faster, provides more detailed socket information, and is actively maintained as part of the iproute2 suite.
