Check the health and availability of your Linux servers for optimal performance with Site24x7's Linux monitoring tool.
The Network File System (NFS) protocol helps provide local access to remote NFS servers. It essentially allows everyone with permission to access files as if they were stored on their local machine. With the help of NFS, we can configure centralized storage solutions, and users can access data even from remote locations. Moreover, NFS can be securely accessed and controlled through firewalls and Kerberos (a network protocol that provides authentication for client-server applications by using secret-key cryptography).
NFS enables computers—regardless of architecture or operating system—to work on the same file systems across a network. NFS can be run on different operating systems because it applies an abstract model of a file system instead of an architectural specification.
When working with NFS, users can see all relevant files regardless of location and work with remote files as if they were in their local file systems. Other benefits NFS offers include:
To make sure that the NFS performance meets our expectations and that we’re not experiencing unexpected
performance issues, we need to monitor NFS performance. Monitoring NFS performance could result in extensive
work if implemented from scratch—so it’s best to use existing tools in the Linux ecosystem instead. There are
two command line tools that can help with monitoring: nfsstat and nfsiostat.
nfsstat commandThe nfsstat command displays information about the currently running NFS server in the system as
well as the remote procedure calls made.
For example, if we run nfsstat -s on the server, the information about the NFS server shown will
include the number of calls that were made and whether there are any bad calls or bad authentications. If the
NFS server has any bad calls, most likely the network system is experiencing network latency problems and
needs to be checked.
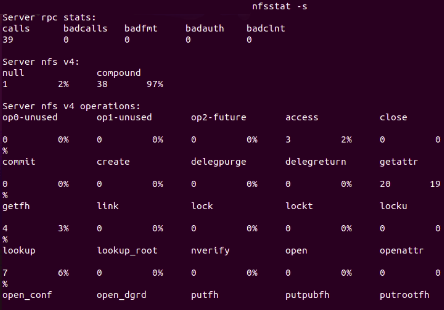 Fig. 1 : NFS server information obtained by running
 We can also gather information from the NFS client, by running nfsstat -c.
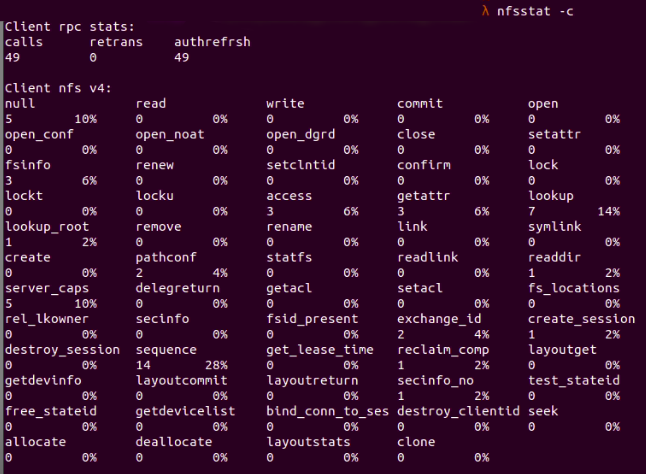 Fig. 2 : NFS client information is displayed by running
Here we can see that the client sent 49 RPC requests, and none of them were rejected. RPC stands for remote procedure calls, and it allows a process on one machine to call a subroutine on another one. RPC is often used for constructing distributed, client-server based applications.
Meanwhile, the client sent 49 NFS requests in total, and none of these requests were rejected either.
nfsiostat commandThe nfsiostat tool provides us with useful information about the behavior of the NFS system by
reading /proc/self/mountstats as input values, then provides the read and write requests of mounted NFS
shares.
 Fig. 3 :
 nfsiostat showing general NFS client
information
Here we can see the mount folder in the current NFS client, which is
/mnt/donald_client_shared_folder
and the mount target in the NFS server, which is
/mnt/donald_shares
Moreover, in the above figure, we can also see the detailed data for read and write requests to the NFS server from the client:
By default, the nfsiostat command will provide the results from the time the share was mounted.
If the data has to be taken for a periodic interval, the count has to be provided as an argument to the
nfsiostat command.
iostat and nfsiostat?The iostat command provides us with input and output statistical data for storage devices so
that we have an idea of how these devices function.
To efficiently diagnose and troubleshoot NFS performance problems, follow the steps outlined below.
First, we need to check whether the network system has any performance issues. We can use several tools for network performance monitoring, such as the vnstat and tcpdump commands.
vnstat is a command line tool that offers network traffic monitoring capabilities for metrics such as bandwidth consumption and traffic flow. vnstat uses kernel information to generate metrics logs.
tcpdump is a network analysis tool that allows users to capture and analyze network traffic flow in the system. tcpdump supports filtering network traffic value by IP, host, port, protocol, or application.
Let’s look at how we can use tcpdump to check the detailed network package that has been sent or received.
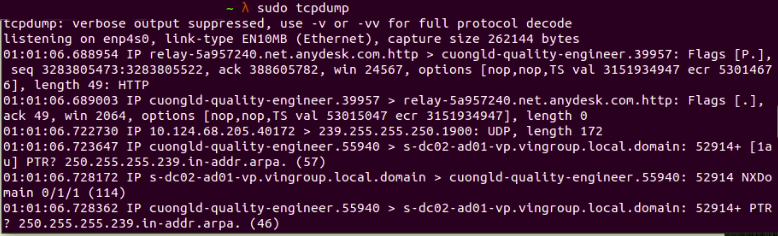 Fig. 4:
 tcpdump showing transmitted and received packets
We can use vnstat to check if there is a problem with the network performance by measuring how much data is going through the network interface.
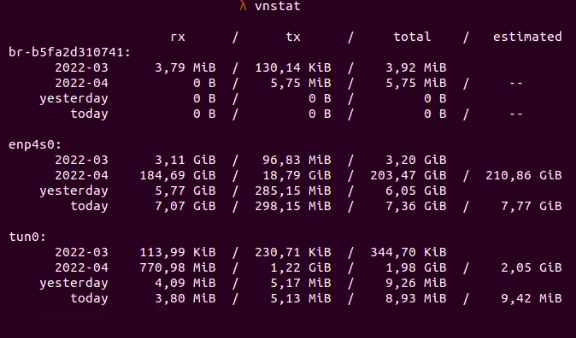 Fig. 5: Data in and out when measured with
 vnstat
In the above scenario, for the data that has gone through network interface enp4s0 here, we have 7.07 GB received and 298.15 MB transmitted data, with the received and transmitted data totaling 7.36 GB.
If we don’t uncover any network performance issues, we need to look at the performance of the NFS server. For example, with nfsstat -r we can find the number of RPC calls made in the server. If there are any bad calls rejected by the RPC layer, the network is probably overloaded, and we need to identify the overloaded network by observing the statistics for that network interface.
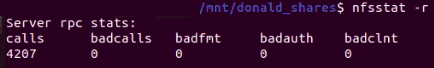 Fig. 6 :
 nfsstat showing RPC calls
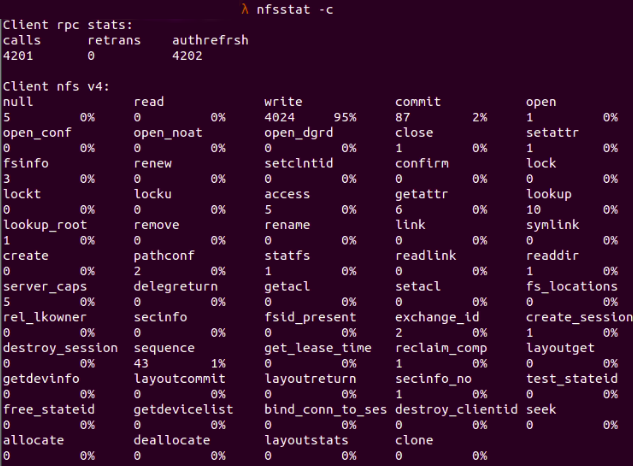
The last thing we need to check is the performance of the NFS client. For example, we can run nfsstat -c to check for NFS client data, like the number of commits or writes made or the number of retransmissions for RPC requests. If the number of retransmissions is huge between client and server, then either the server is busy or there is a loss in pocket. The retransmissions number is displayed as retrans in the client rpc stats part.
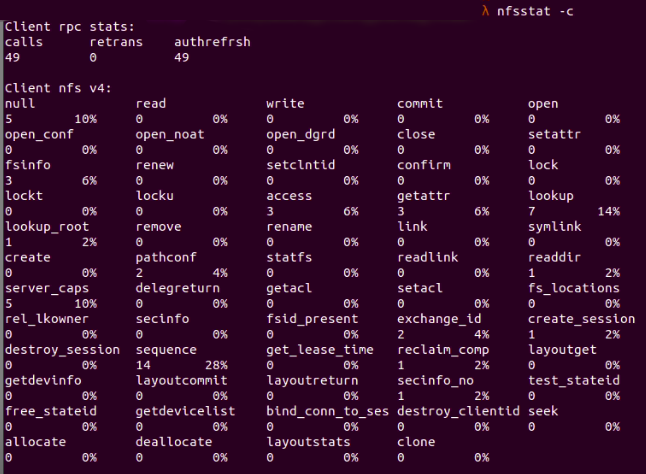 Fig. 7 :
 nfsstat -c shows the NFS client data in detail
Moreover, we can combine it with nfsiostat -d to check for statistics related to the NFS server directory.
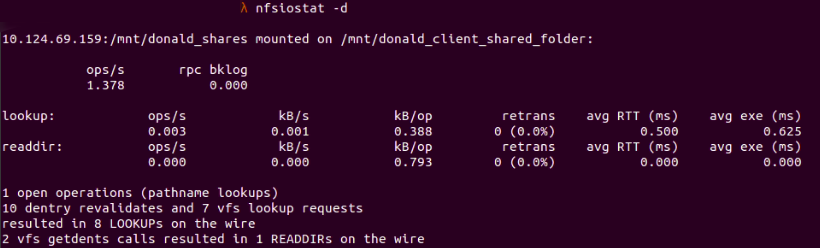 Fig. 8 :
 nfsiostat -d showing statistics for a directory that mounts to the NFS server
nfsiostatClients will get the most use out of NFS systems, as they’re likely to be data scientists or data engineers using the NFS system to access vast data for training models. If a client cannot troubleshoot or locate the problem on their end, network administrators can initiate troubleshooting from the server side.
The nfsiostat tool is great for detecting problems from the client side and provides several options for collecting helpful metrics. Let’s see a few examples of its use.
Check for overall statistics of the NFS client by running nfsiostat without parameters:
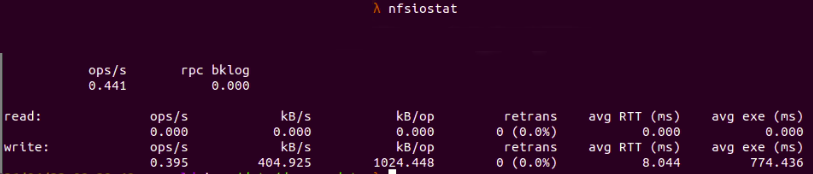 Fig. 9 :
 nfsiostat shows general information
If we suspect the NFS client is experiencing performance issues connecting to the NFS server, avg RTT and retrans are the metrics we should look out for. High average time for RTT and a high number of transmissions point to a high latency problem in the NFS system that makes the connection between NFS client and server unstable and leads to timeout issues.
Display statistics related to cache with nfsiostat -a:
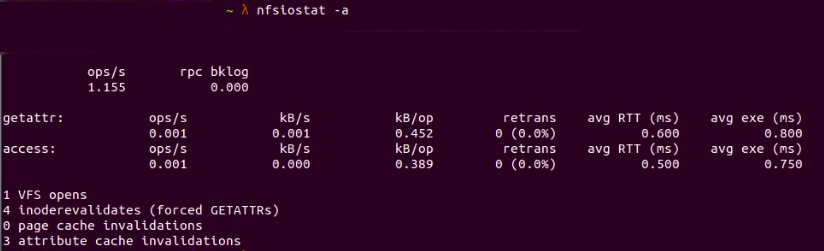 Fig. 10 : Showing cached data with
 nfsiostat -a
Page cache invalidations shows the number of times the cache is made to be invalid in the client—in this case it’s 0. Attribute cache invalidations shows the number of attributes in cache, such as modification time or owner—in this case, we have 3.
Apply caching prevents the NFS server from being overloaded with requests sent from the NFS client. However, if the cache time is high, we can run into a “File not found” issue, when a client tries to read a file in the server using old cache data but the file in the server is already updated to the new version. Therefore, we should set the configuration for applying caching appropriately, to match our own use cases.
Display statistics related to page cache with nfsiostat -p:
Fig. 11 : Showing page cache with nfsiostat -p
Sort NFS mount points by number of operations per second by running nfsiostat -s:
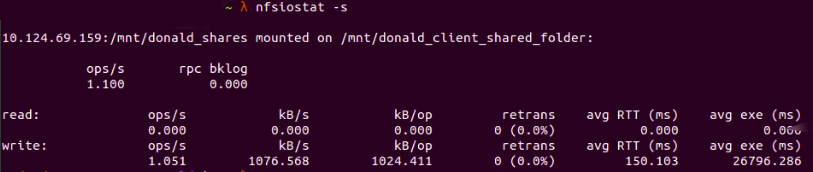 Fig. 12 : Sort NFS mount points with
 nfsiostat -s
Display output at specific intervals after every ${a} seconds, and output ${n} times by running nfsiostat ${a} ${n}:
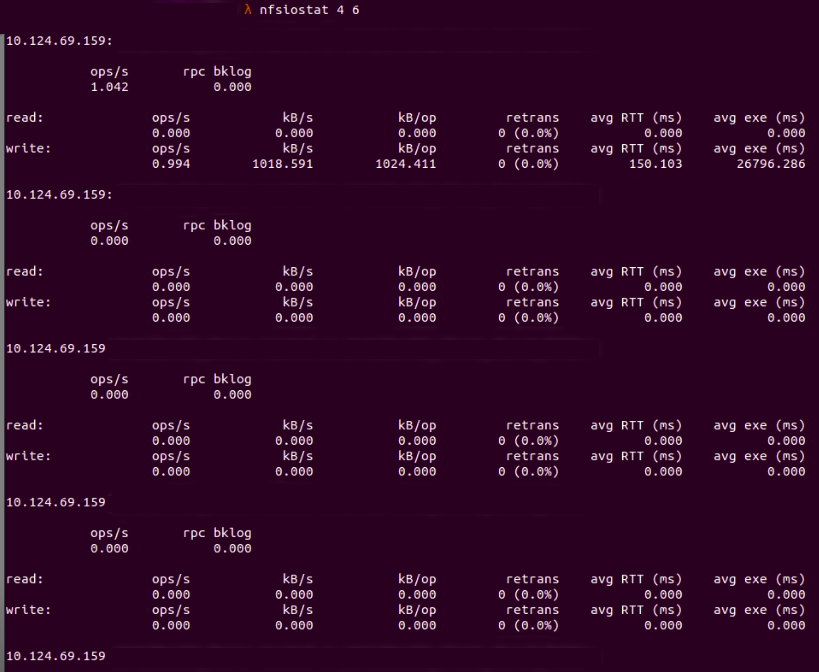 Fig. 13 : Requests in NFS after every 4 seconds and 6 times only
There are many factors that can directly or indirectly cause NFS performance issues. In this article, we’ve covered several significant symptoms that point to performance problems in your NFS system and helped you identify them by using the nfsiostat tool in Linux.
Supported tools like nfsiostat can make troubleshooting NFS performance issues, an otherwise lengthy and time-consuming process, easier to carry out.
Site24x7 server monitoring can track system-level metrics like I/O wait and network traffic, helping you correlate these metrics with NFS performance issues.
Yes, Site24x7 server monitoring can track system-level metrics like disk utilization and I/O wait, which help you correlate these metrics with NFS performance issues.
Site24x7 does NOT support monitoring NFS specifically. However, Site24x7 server monitoring can track system-level metrics like disk utilization and I/O wait, which help you correlate these metrics with NFS performance issues.
