Check the health and availability of your Linux servers for optimal performance with Site24x7's Linux monitoring tool.
System administrators often receive complaints related to poor server performance, and it can be difficult to troubleshoot these issues as they are subjective. An end user's slow server experience may be caused by a process that is running and consuming more resources than usual or there might actually be something wrong with the server.
Whatever the reason may be, it is important to regularly monitor server performance to:
In this article, we’ll discuss various metrics used to monitor server performance and troubleshoot performance issues.
Several metrics can help monitor the three pillars of any server—CPU, RAM, and Disk IO—to get an idea of how your Linux server is performing. Some of these metrics are:
Various performance issues occur in different operating systems or services, and every issue requires a unique approach to troubleshooting. Most issues are caused due to CPU, disk, memory, networking, and IO.
Each area yields different symptoms and needs another diagnosis and solution to mitigate server slowness.
For instance, if the server is slow or outdated, the system will not be able to keep up with the requirements for modern applications. This can lead to end users experiencing an increase in the response time, making them frustrated and decreasing their confidence in your application.
Database queries could also take too long to retrieve data, leading to poor application performance. A sluggish server can additionally directly impact the CPU’s capability to be utilized.
Lastly, poor server performance may sometimes lead to downtime, although the probability of this occurring is low.
Overuse of system load is probably one of the most common causes of system slowness.
CPU-bounded system load can create issues due to processes waiting for CPU resources, whereas RAM-bounded system load can lead to high I/O wait times since the system starts using a swap in the server when it runs out of RAM. Meanwhile, IO-bounded system load can cause slowness since processes compete for disk or network I/O resources. High CPU user time can contribute to high system load as well.
Additional factors that can lead to a slower server include:
Linux offers various commands to help you troubleshoot system performance. These commands help to monitor various components of your system, such as memory, CPU, and IO. The three most commonly used commands are top, vmstat, and iostat commands.
top commandThe top command is the most commonly used command for displaying the overall view of a system. It summarizes the various CPU-level metrics discussed in the above sections, including uptime, load averages, and I/O wait time. In addition, it displays a running list of processes or tasks currently being managed by the kernel.
Syntax:
top [options]
Example:
Running the top command will display an output similar to that shown below:
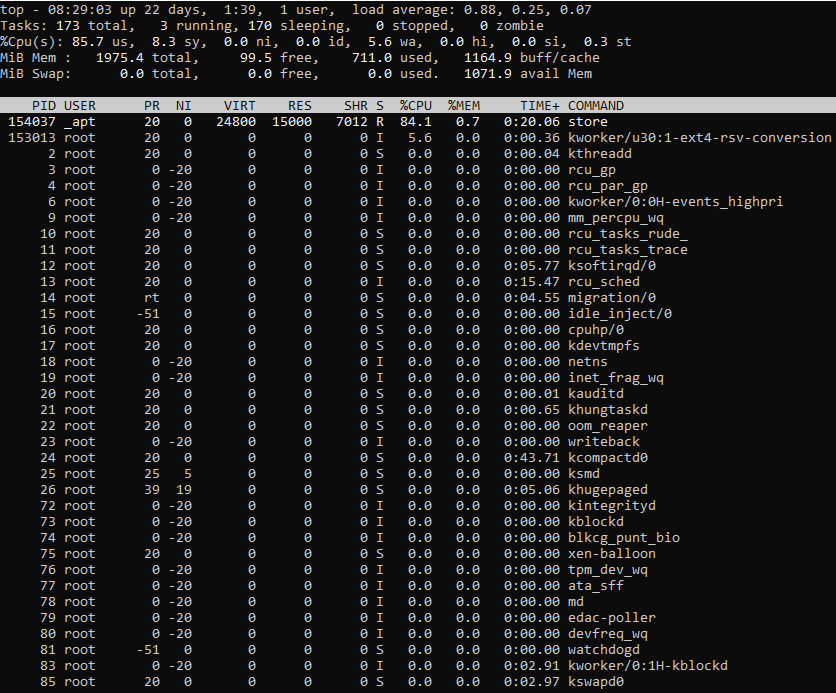 Fig 1: Output of top command
As you can see in the above output, the first section displays the real-time and dynamic summary of the system.
The first line displays the uptime along with the system load averages over the last one, five, and 15-minute periods. If the load average is higher than the normal load value, i.e., 0.7 for one and five-minute intervals, it can be ignored. When the load average remains consistently higher than 0.7 for a longer duration, it is a clear indication that the server is overloaded.
The second line displays various task-level information, including active, running, and sleeping tasks.
The third line, labeled %CPU(s), displays the various CPU-level statistics. Some metrics to monitor here are:
The fourth and fifth lines display data about the system memory, while the final section displays the dynamic and real-time list of processes. You can sort this list based on the different columns shown. For example, pressing P will sort the processes based on the %CPU column.
vmstat commandThe next important command on the list is vmstat, which stands for virtual memory statistics. It is a performance monitoring tool provided by Linux that displays various statistics about the different components of the system, including memory, IO, and CPU.
By default, this command displays reports since the system was last rebooted. However, you can also view real-time statistics, which are updated after an interval specified by you.
Syntax:
vmstat [options][delay [count]]
The two parameters you can use to view real-time reports are:
Example:
Running the vmstat command will give you an output similar to the following:
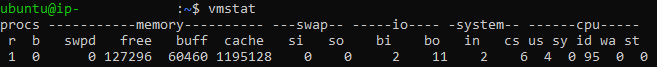 Fig 2: Output of
 vmstat command
The output is divided into five sections.
memory section displays the following information:swap section displays the following information:io section displays the following information:system section displays the following information:The cpu section displays data similar to that found in the %Cpu(s) line of the top command output.
iostat commandiostat is an important and widely used command to monitor your system’s input/output statistics. While commands like top or vmstat may help you discover that the server is experiencing a high I/O wait time, you should also know which devices/partitions are under load and causing the high I/O wait time.
The iostat command does just this and generates device-level reports. Besides, it also yields CPU-level statistics similar to those provided by the top and vmstat commands. Just like vmstat, the output produced is, by default, for the time since the system was last rebooted, but you may view real-time data by providing a couple of extra parameters.
Syntax:
iostat [option] [interval] [count]
The interval and count parameters here are similar to that in the vmstat command and are used to show the real-time updates infinitely or for specific counts.
Example:
Running the iostat command will give you an output similar to the one shown below:
 Fig 3: Output of
 iostat command
As you can see in the above output, the first line displays the CPU report:
The next section shows the following statistics for all the devices/partitions in the system:
A very high Blk_wrtn/s or Blk_read/s for a particular device or partition should be investigated, as it may be increasing load on the CPU and hence decreasing the server performance.
Server performance is crucial, as it can directly impact an application’s user base. Monitoring performance metrics helps identify and fix any issues in the server before it could affect your application.
In this article we’ve mentioned major commands—top, vmstat, and iostat—that can be used to narrow down what’s causing system slowness. The methods described here can be used to troubleshoot and fix performance issues.
Site24x7 offers an agent-based Linux monitoring solution that continuously tracks CPU, memory, disk, and network performance without requiring manual command execution.
Yes, you can configure thresholds for metrics like system load, CPU usage, or I/O wait times, and Site24x7 will alert you via email, SMS, or voice calls.
Yes, Site24x7 stores historical performance data for your Linux servers, allowing you to view past performance trends, capacity planning, and generate reports.
