AWS Monitoring helps you gain observability into your AWS environment
Over the past few years, cloud computing has transformed how organizations manage their applications to keep data safe and secure. Amazon ECS (Elastic Compute Service) has made it easier for businesses to scale their infrastructure on demand. However, with growth comes complexity. Monitoring can be time-consuming and challenging, especially in highly dynamic environments such as Amazon ECS.
This article explores the key metrics used to measure performance in Amazon ECS and provides an overview of the most important metrics you should monitor. We also discuss how these metrics can help you gain better insight into your system health and performance, enabling you to optimize your services more effectively.
Amazon EC2 is a service for creating and deploying virtual machines in a cloud environment. With support for Windows, Linux, and Unix operating systems, Amazon ECS allows users to run virtual machines on demand or execute applications in the AWS platform.
The Amazon Web Services EC2 cloud computing service lets you access virtual machines on demand. In contrast, the Amazon Web Services ECS cloud container management service enables you to manage and run containers.
There are several key differences between Amazon EC2 and Amazon ECS:
Application performance refers to the response time of your applications and the number of requests they process. It helps you understand how quickly your applications respond to requests, allowing you to adjust their configurations to improve performance.
The optimal resource allocation for each instance depends on the application's specific needs, cluster size, and available resources. In general, it is best to allocate resources that are balanced, ensuring that the CPU, memory, and storage utilization are all within the desired range. Additionally, it is crucial to monitor the utilization of each resource to ensure that the application is running optimally and that the resources are adequately utilized.
Amazon ECS monitoring helps containerized applications run smoothly and efficiently in the Amazon environment. It allows you to keep an eye on the performance of your ECS clusters to monitor and troubleshoot your containers, tasks, and services.
Regardless of whether you execute ECS tasks on EC2 or Fargate, you can take advantage of CPU usage data at the container level to detect containers consuming excessive resources. CPU usage and reservation data are reported by ECS as a ratio of CPU units multiplied by 100. The CPU unit represents the CPU capacity of an instance, regardless of its underlying hardware.
When you discover that specific containers are consuming a high amount of CPU resources, you may need to specify CPU limits at the container level to ensure that other containers can perform their tasks.
This provides a percentage of all CPU units reserved for the currently executing tasks in an ECS cluster. It is helpful to know how this metric changes over time. If the tasks haven't been deployed correctly, they will reserve more CPU time than available. Hence, while the tasks are running their lifecycles, you should know the CPUReservation peak values and when your ECS cluster hits them.
This represents a percentage of all reserved CPU units that the currently executing tasks are consuming in the cluster. This metric helps you identify whether your containers are overloading your CPU resources.
If the CPU utilization is high, you may need to scale up your computing resources or find ways to optimize your code. If the CPU utilization metric exceeds 80%, you may need to increase the number of instances or resize your current ones.
Containers can easily utilize all of your available memory if not monitored closely. It is a good practice to keep an eye on this metric to determine the amount of memory being consumed by containers and avoid potential outages caused by memory-contention issues or other performance problems.
This metric tells you how much memory each instance uses at any given time, i.e., the percentage of memory utilization in the cluster. It helps to track this metric to avoid outages caused by memory-contention issues.
By monitoring ECS memory usage, you can determine whether your infrastructure has been scaled appropriately. ECS will terminate any container that exceeds its hard memory limit, so you should monitor container-level memory consumption. To keep your processes running, you may need to adjust your task definitions to raise or eliminate this hard limit.
You can use this metric to better understand how much memory your containers are consuming over time. If the memory usage is high, it may indicate that you need more resources or that your applications are not optimally configured.
Amazon ECS allows you to configure memory at both the task and container levels. Task-level memory represents the job's hard memory limit for that specific task. MemoryReservation (a soft limit) and MemoryAllocation (a hard limit) allow you to manage memory allocation for your tasks at the container level. Specifying a container-level memory value is optional if a task-level memory value has already been specified.
This represents the current memory usage for each container. This metric enables you to monitor each container's memory usage information over time. If you have set a hard limit on the maximum allowed container-level memory usage, you can increase it by updating the task definitions as required.
You can monitor your ECS I/O to watch for misconfigurations and determine the best possible configuration. This is important because containerized environments are intrinsically transient, so storage can be tricky. This metric can help you determine an optimal solution.
This metric provides the volume of bytes transferred while reading data over a period in an EBS volume.
This metric tracks the volume of bytes transferred while writing data over a period in an EBS volume. In other words, it provides you with information related to write operations performed over a period of time.
I/O bytes represent the number of bytes read or written in a particular Docker container.
When you switch on CloudWatch metrics for Amazon ECS, metrics will display on both CloudWatch and Amazon ECS consoles.
Follow the steps below to view metrics via the Amazon ECS console:
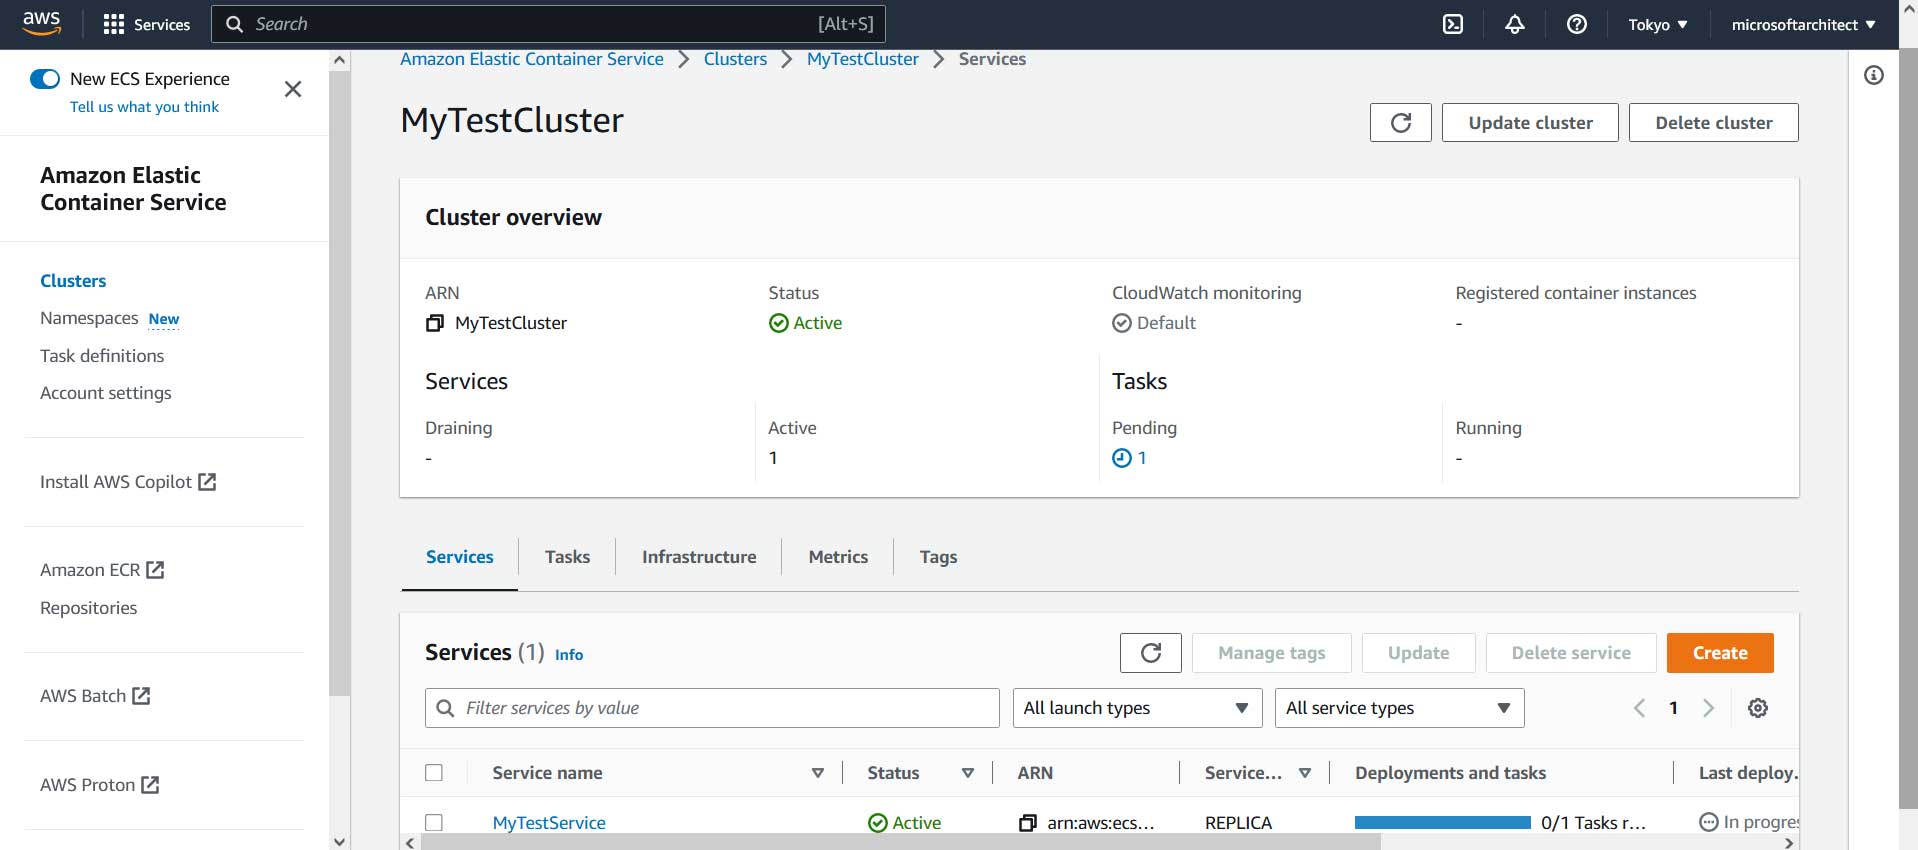 Fig. 1: Selecting a service in a cluster in AWS
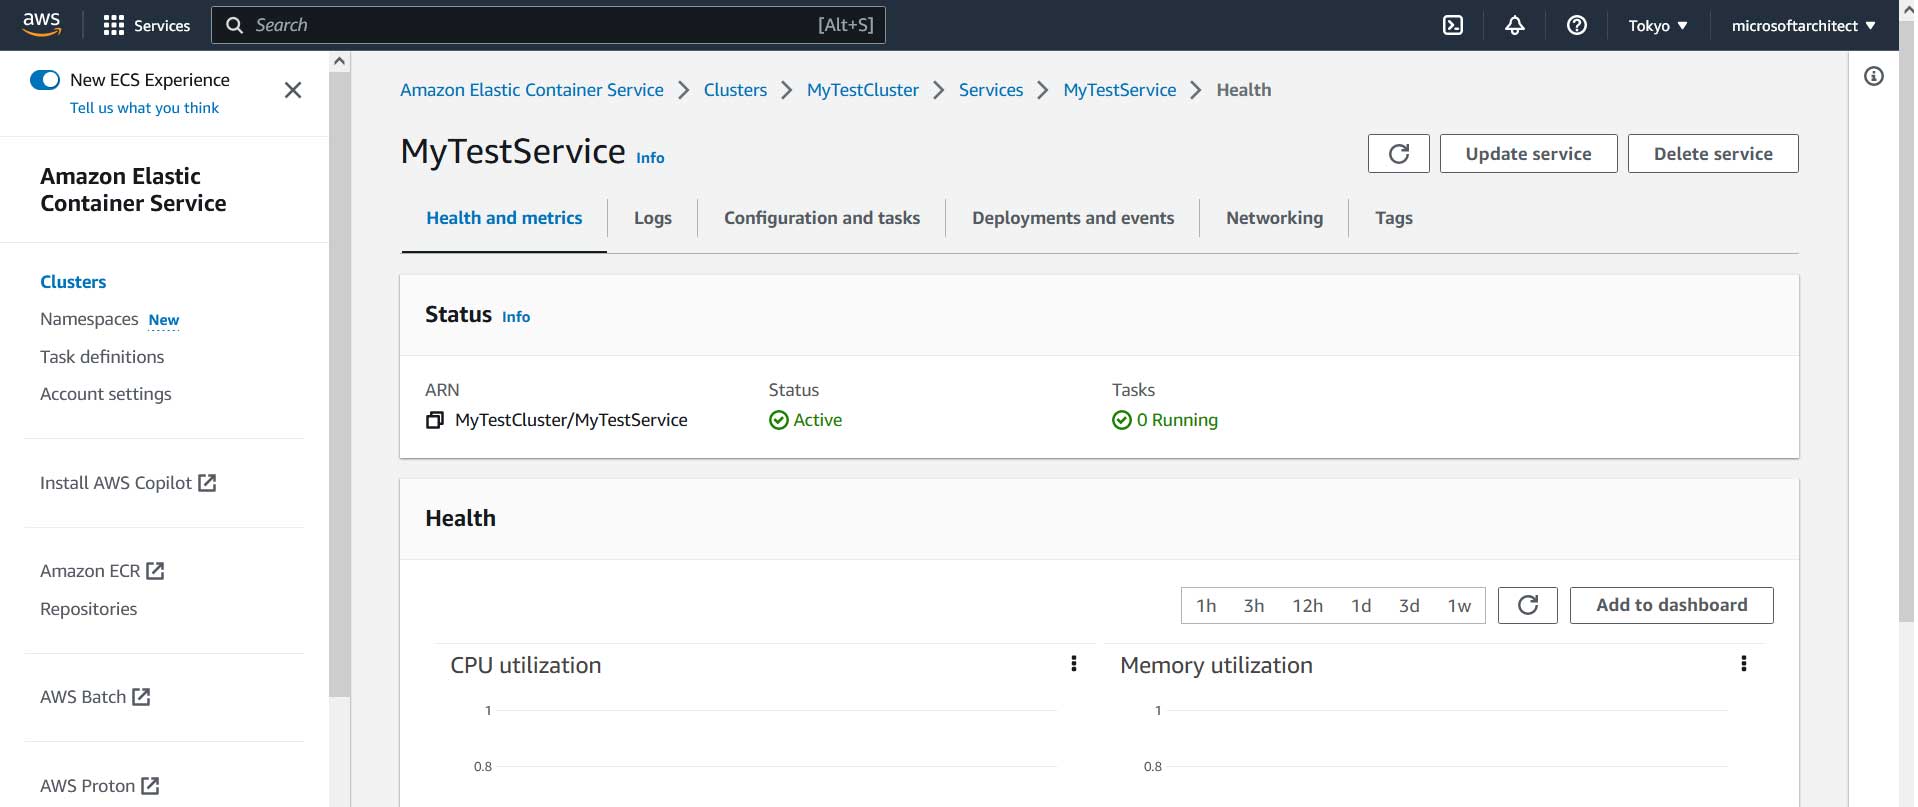 Fig. 2: Selecting metrics for the service in AWS
Amazon CloudWatch collects raw data from Amazon Elastic Compute Cloud (ECS) and converts it into relevant metrics in near real-time. This allows Amazon CloudWatch to monitor your Amazon ECS resources efficiently. The data collected from your clusters or services is persisted for two weeks so that you can better see their performance over time.
CloudWatch receives Amazon ECS metrics every minute, with its interface providing a comprehensive view of them all. Depending on your needs, you can customize the display to show, for example, service usage or the number of tasks currently executed.
As your business and technology stack grows, having the right metrics to monitor will help quickly determine an application's potential issues, as well as performance and scalability bottlenecks–before they become a problem while also ensuring optimal user experience.
Organizations that take advantage of key metrics can gain real-time visibility into their application's performance. Proper analysis and the necessary strategies enable you to make sure your applications are running smoothly and efficiently—and save money in the process.
Site24x7 uses CloudWatch APIs to collect critical ECS metrics like CPU and Memory utilization across your clusters and services, presenting them in a single dashboard.
Yes, Site24x7 allows you to set custom thresholds on metrics such as MemoryUtilization and CPUReservation, instantly notifying you if tasks crash or approach their hard limits. Additionally, Site24x7 supports dynamic thresholds (AI-based anomaly detection) for these metrics, which can automatically adapt to your workload patterns.
Yes. Site24x7 tracks resource allocation and usage for ECS containers running on both EC2 instances and the serverless AWS Fargate engine.
