MySQL Monitoring
Monitor your MySQL operations, database attributes, and be alerted to database performance spikes through instant alarms. The MySQL server can be monitored using the Site24x7 server monitoring agent. The MySQL server running in the server will be auto-discovered and added for monitoring once the agent is successfully installed.
Supported versions:
- MySQL version 5.6 and above
- Site24x7 Linux server monitoring agent version 19.0.0 and above
- MariaDB monitoring will be supported only if the Site24x7 Linux server monitoring agent version is 19.4.0 or above.
Adding a MySQL monitor
Prerequisites
You need to create a MySQL user for the Site24x7 agent on each MySQL server. With the following instructions, you can create a user and grant the MySQL user with the permission to log in from any host using 'username'@'hostname'.
You also have the option to restrict the user to log in only from localhost by using 'username'@'localhost'.
CREATE USER 'username'@'localhost' IDENTIFIED BY '<PASSWORD>';
Example:
CREATE USER 'site24x7'@'localhost' IDENTIFIED BY 'Monitoring@123';
Create the user with the native password hashing method as shown below (for MySQL versions 8.0 and above):
CREATE USER 'username'@'hostname' IDENTIFIED WITH mysql_native_password by '<PASSWORD>';
Example:
CREATE USER 'site24x7'@'localhost' IDENTIFIED WITH mysql_native_password by 'Monitoring@123';
The Site24x7 agent needs a few privileges to collect the metrics. You need to provide the MySQL user with the following limited privileges:
GRANT REPLICATION CLIENT ON *.* TO 'username'@'hostname';
GRANT REPLICATION SLAVE ON *.* TO 'username'@'hostname';
GRANT PROCESS ON *.* TO 'username'@'hostname';
GRANT SHOW DATABASES ON *.* TO 'username'@'hostname';
Also, grant the user the SELECT permission on the performance_schema database to collect the metrics like average query run time, the query executed, error count, warn count, and so on.
GRANT SELECT ON performance_schema.* TO 'username'@'hostname';
Grant the following permission to the sys database to collect the in-depth metrics for each database discovered, like the total latency, the number of scans performed, error statements, input-output (IO) activity, and so on.
GRANT SELECT ON sys.* TO 'username'@'hostname';
GRANT EXECUTE ON sys.* TO 'username'@'hostname';
Grant the following permission in case the instance belongs to MariaDB version 10.5 or above:
GRANT SLAVE MONITOR ON *.* TO '<username>'@'<hostname>';
If there are multiple MySQL Instances, repeat the above steps for each MySQL Instance. After providing the required permissions, you can proceed to add a MySQL Server Monitor using the following steps:
For Linux
- Install the Site24x7 Linux server monitoring agent on your Linux server.
- Site24x7 server monitoring agent automatically discovers MySQL instances in your servers and adds a sample view of MySQL monitor at Home tab. To start monitoring, follow the instructions below to authenticate Site24x7 to collect metrics.

- Execute the following command in your terminal to authenticate and configure MySQL monitoring:
/opt/site24x7/monagent/scripts/AgentManager.sh mysql --add_instance
Enter your MySQL instance's user credentials, including host name, port of the MySQL instance to be monitored, and the username and password previously created for the Site24x7 agent. If you want to configure SSL, respond with Y. If not, respond with N.

- After logging into Site24x7, click Server > MySQL on the navigation pane to the right.
- You can view the list of the auto-detected MySQL instances or Clusters you have added to monitor.
- Under the MySQL instance, click Databases to view the list of databases in the selected Instance.
- The username and the password you provide will be securely encrypted in the agent and will not be stored in any of the Site24x7 databases.
- If you don't want the application to be auto-discovered and added for monitoring, toggle No for the option Auto discover applications on the server in the Settings page (Admin > Server Monitor > Settings).
- By default, ten databases will be auto-discovered in each MySQL instance.
Performance metrics
Track and measure critical performance metrics of your MySQL and MySQL database, such as attempted connections, aborted connects, buffer pool utilization, threads running, slow queries, and more, from a unified console.
Dashboards and views
Health Dashboard
After successful addition of the MySQL server monitor, you'll be directed to the Health Dashboard, where you can view and analyze the performance of your MySQL server environment and detect performance outages.
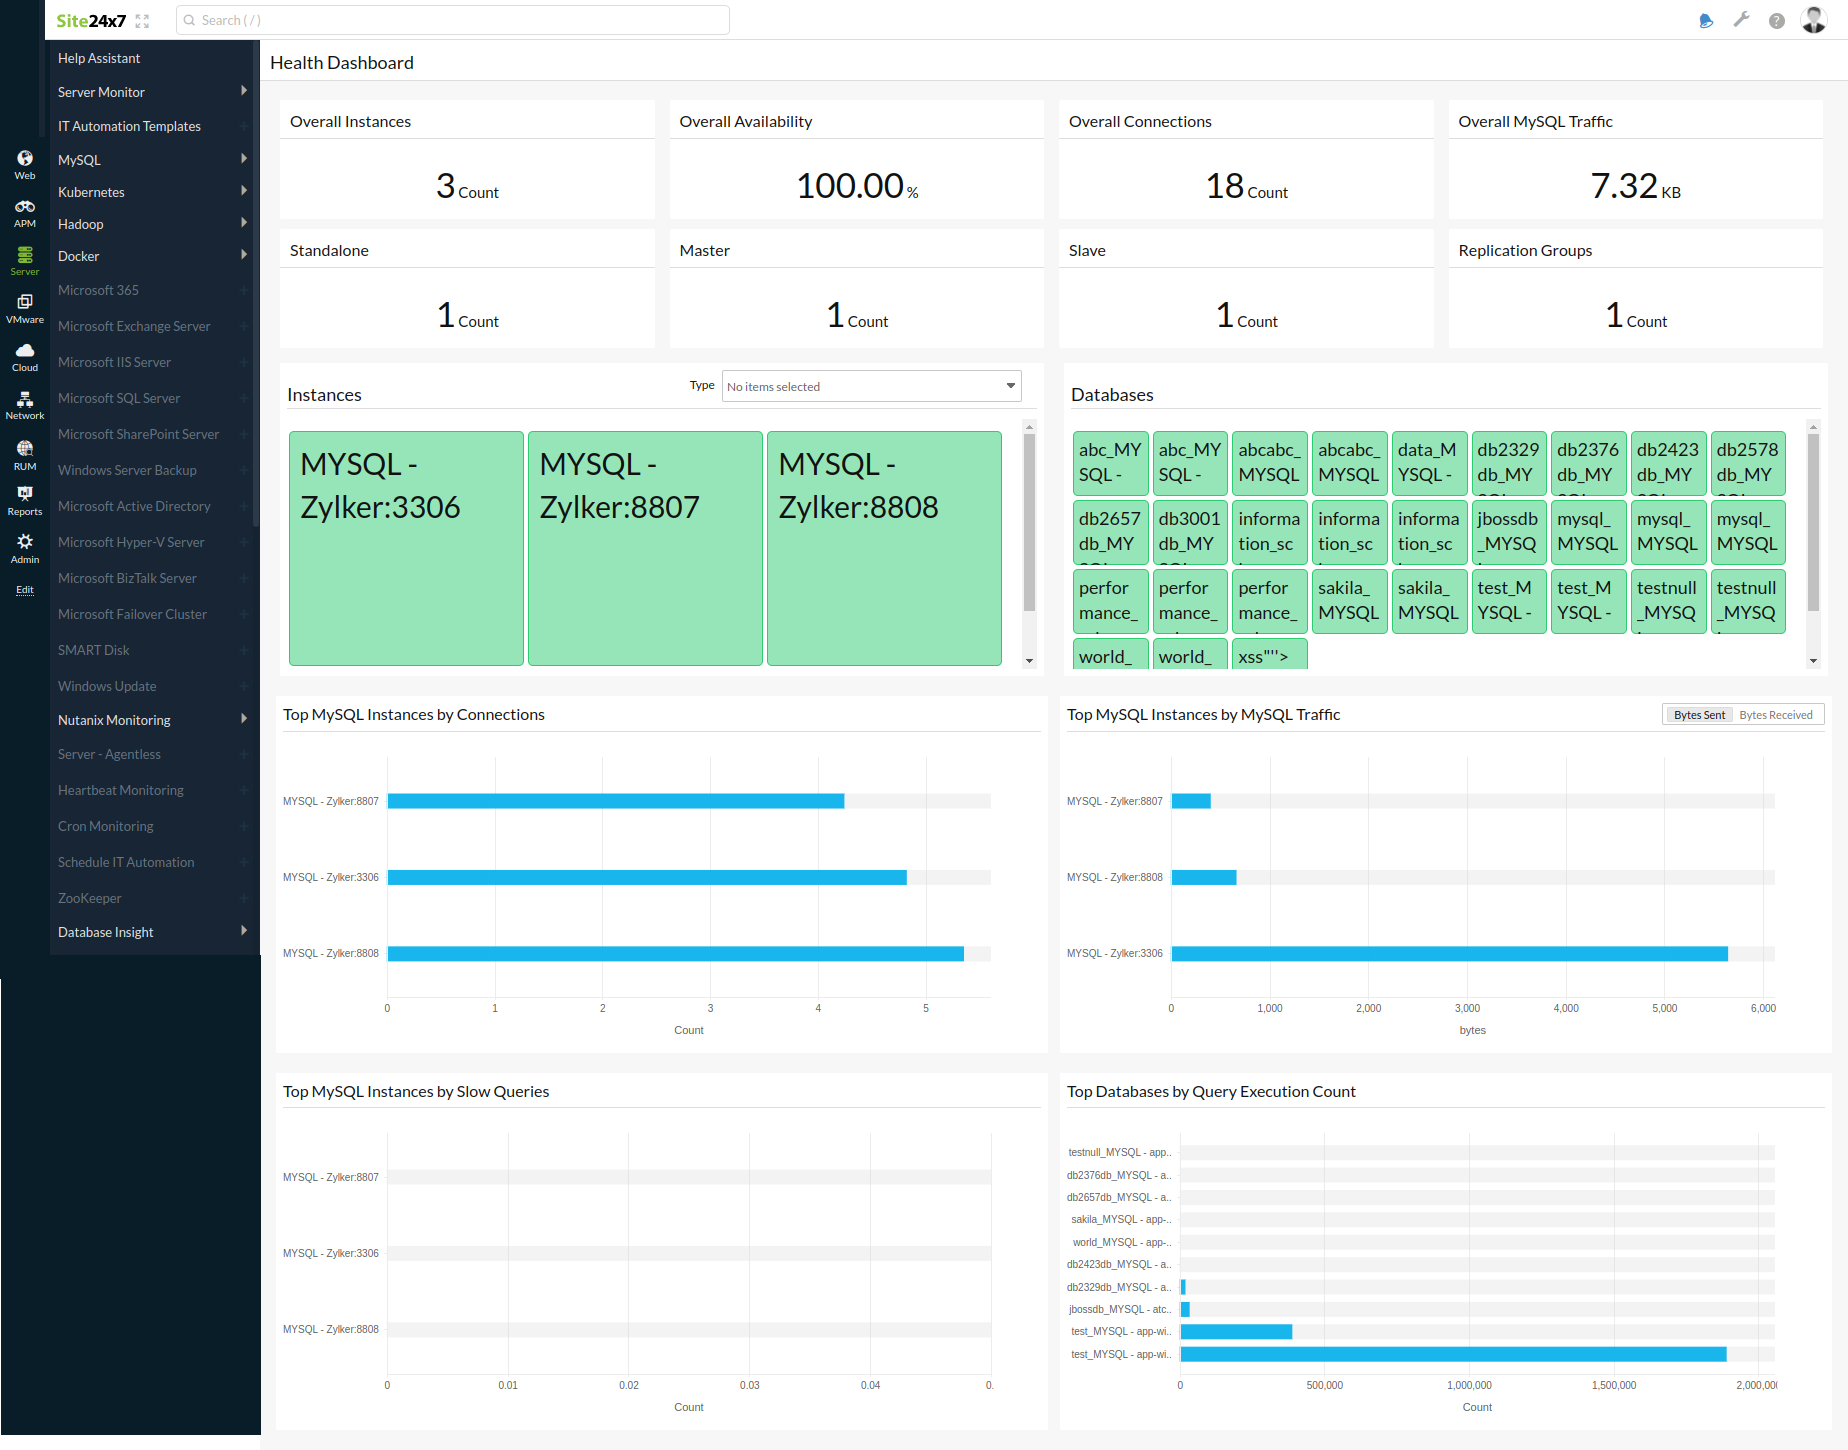
- See the total number of all the MySQL servers in one view.
- View the current status of all the MySQL servers as separate NOC dashboards. Click on a NOC box to go to that particular resource's Summary page.
- Identify issues faster by seeing the status of your servers as Down, Critical, or Trouble.
- Analyze the top CPU and memory utilizing instances to troubleshoot performance issues instantly and avoid future performance degradation.
Topology View
The Topology View of the MySQL server monitor enables you to explore the relationships between the servers associated in your replication group, i.e., you can effortlessly find the Slave servers that are associated with a particular Master server and vice versa.
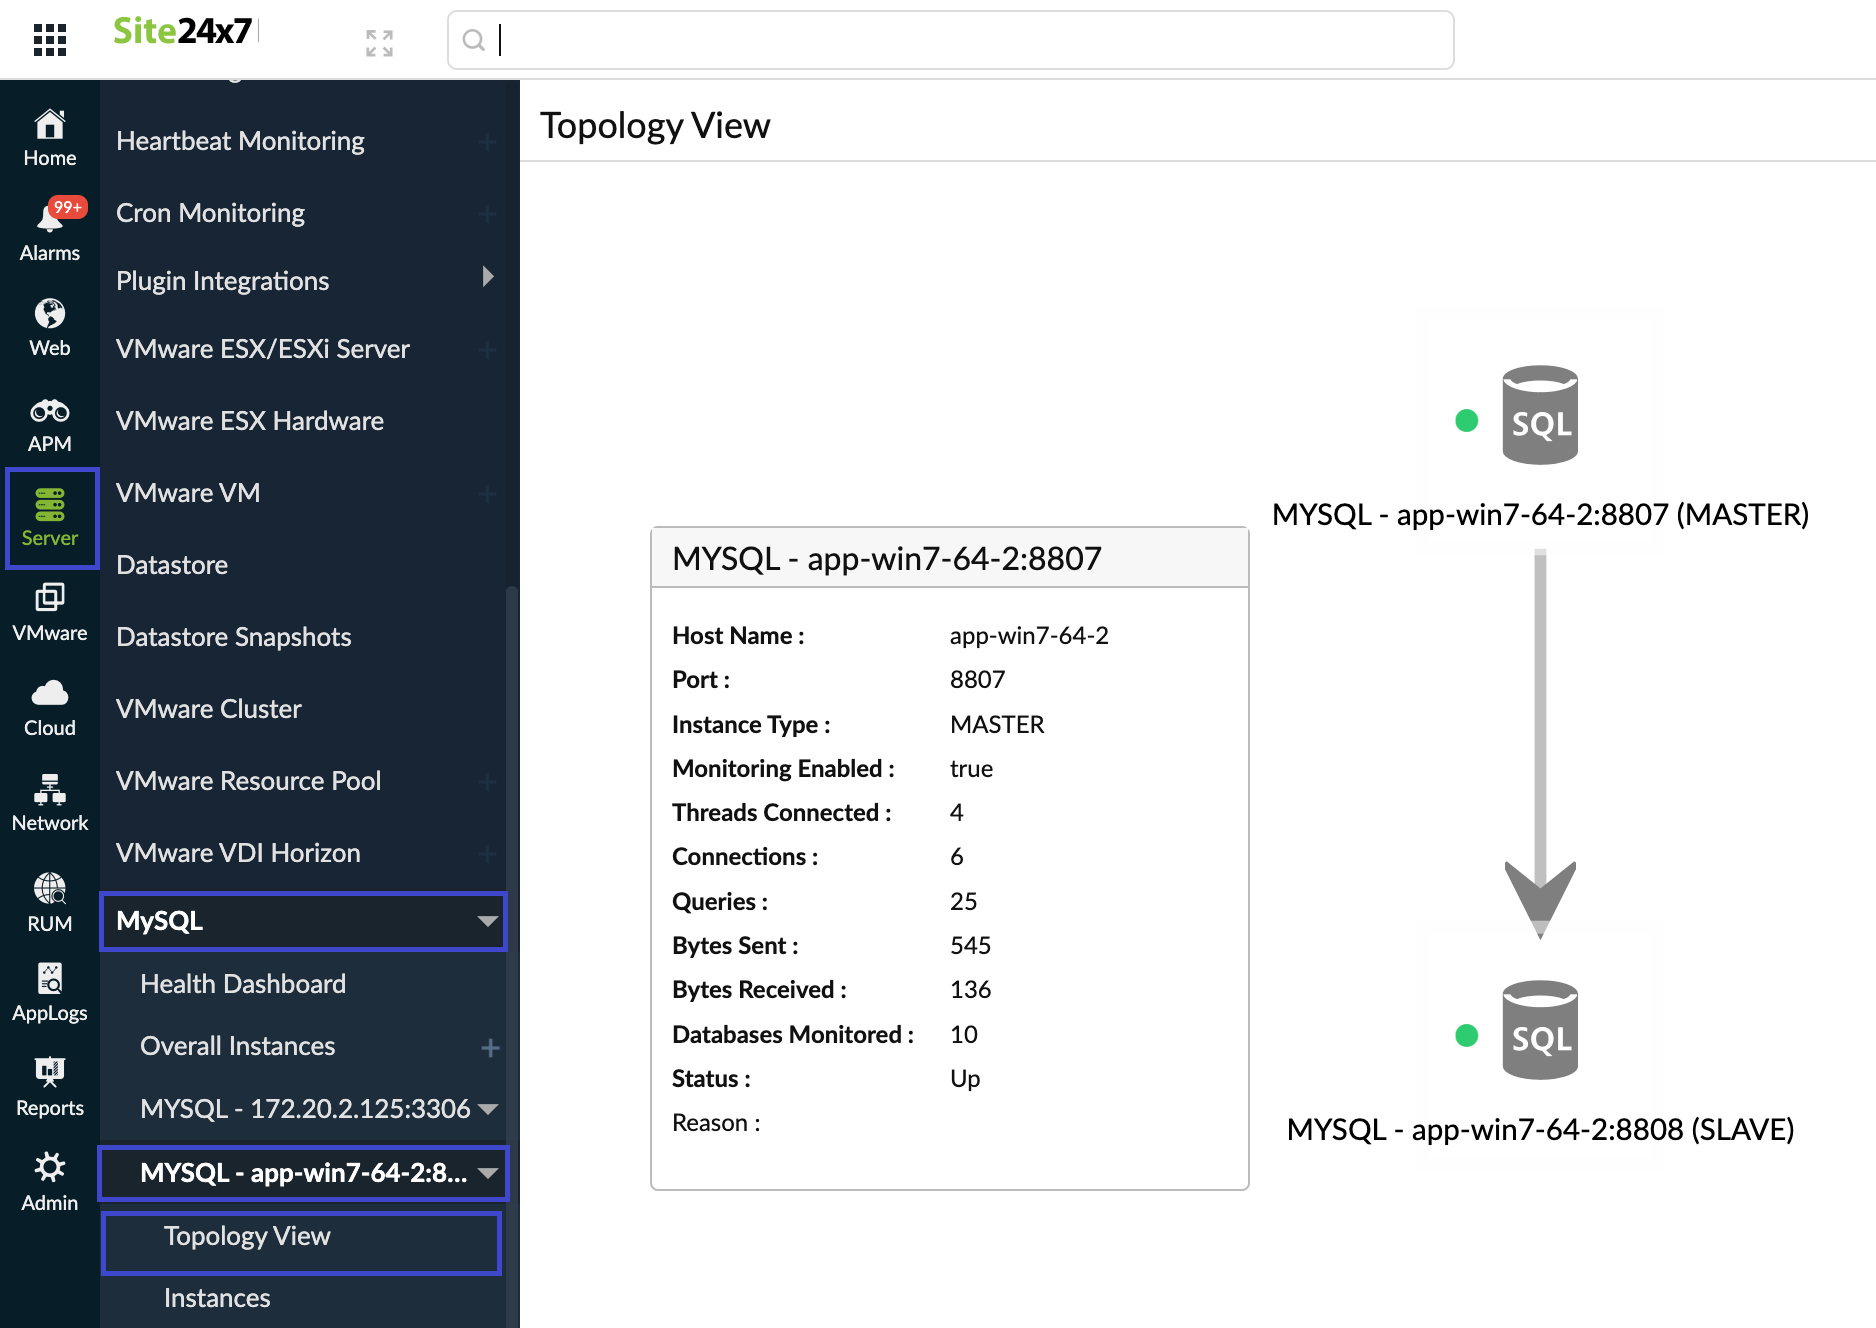
To get to the Topology View, go to Server > MySQL and select a replication group that is listed under Overall Instances > Topology View.
You can get an overview of all the important metrics, statuses, and details of a particular instance by hovering over them.
Instances
The list of all the MySQL instances monitored that belong to a particular replication group is listed under the Instances tab below the Topology Chart (Server > MySQL > select a replication group that is listed under Overall Instances > Instances).
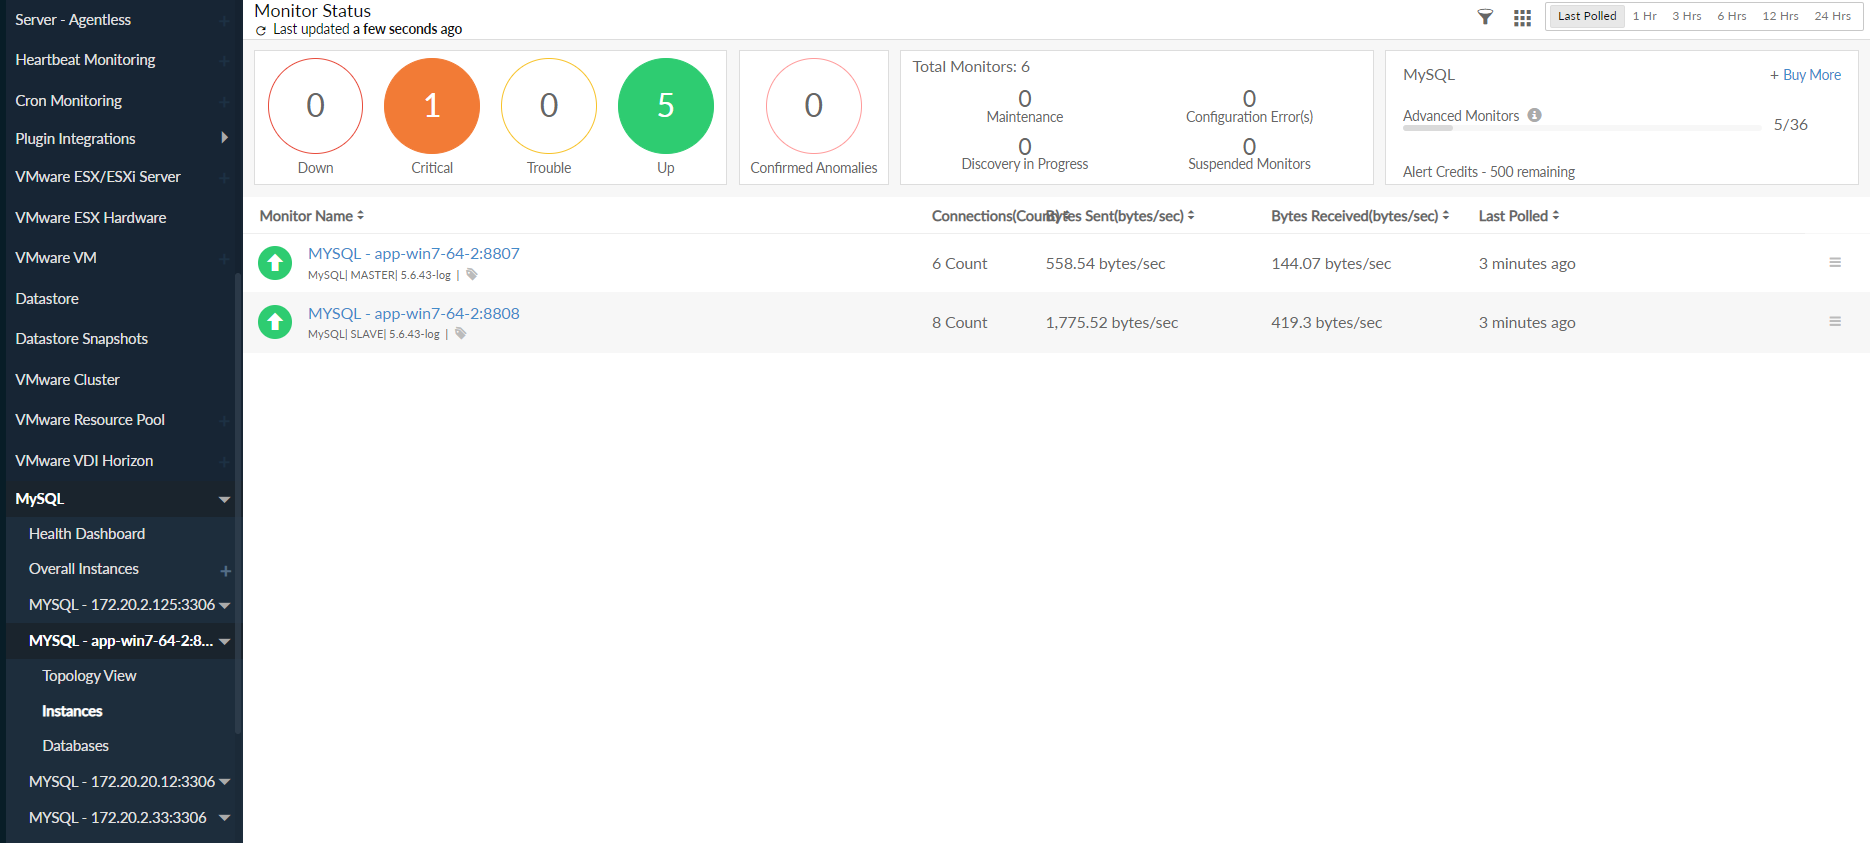
You can also view the statuses of those instances and perform actions including editing, suspending, and deleting the instance by clicking the hamburger icon near the instance.
Databases
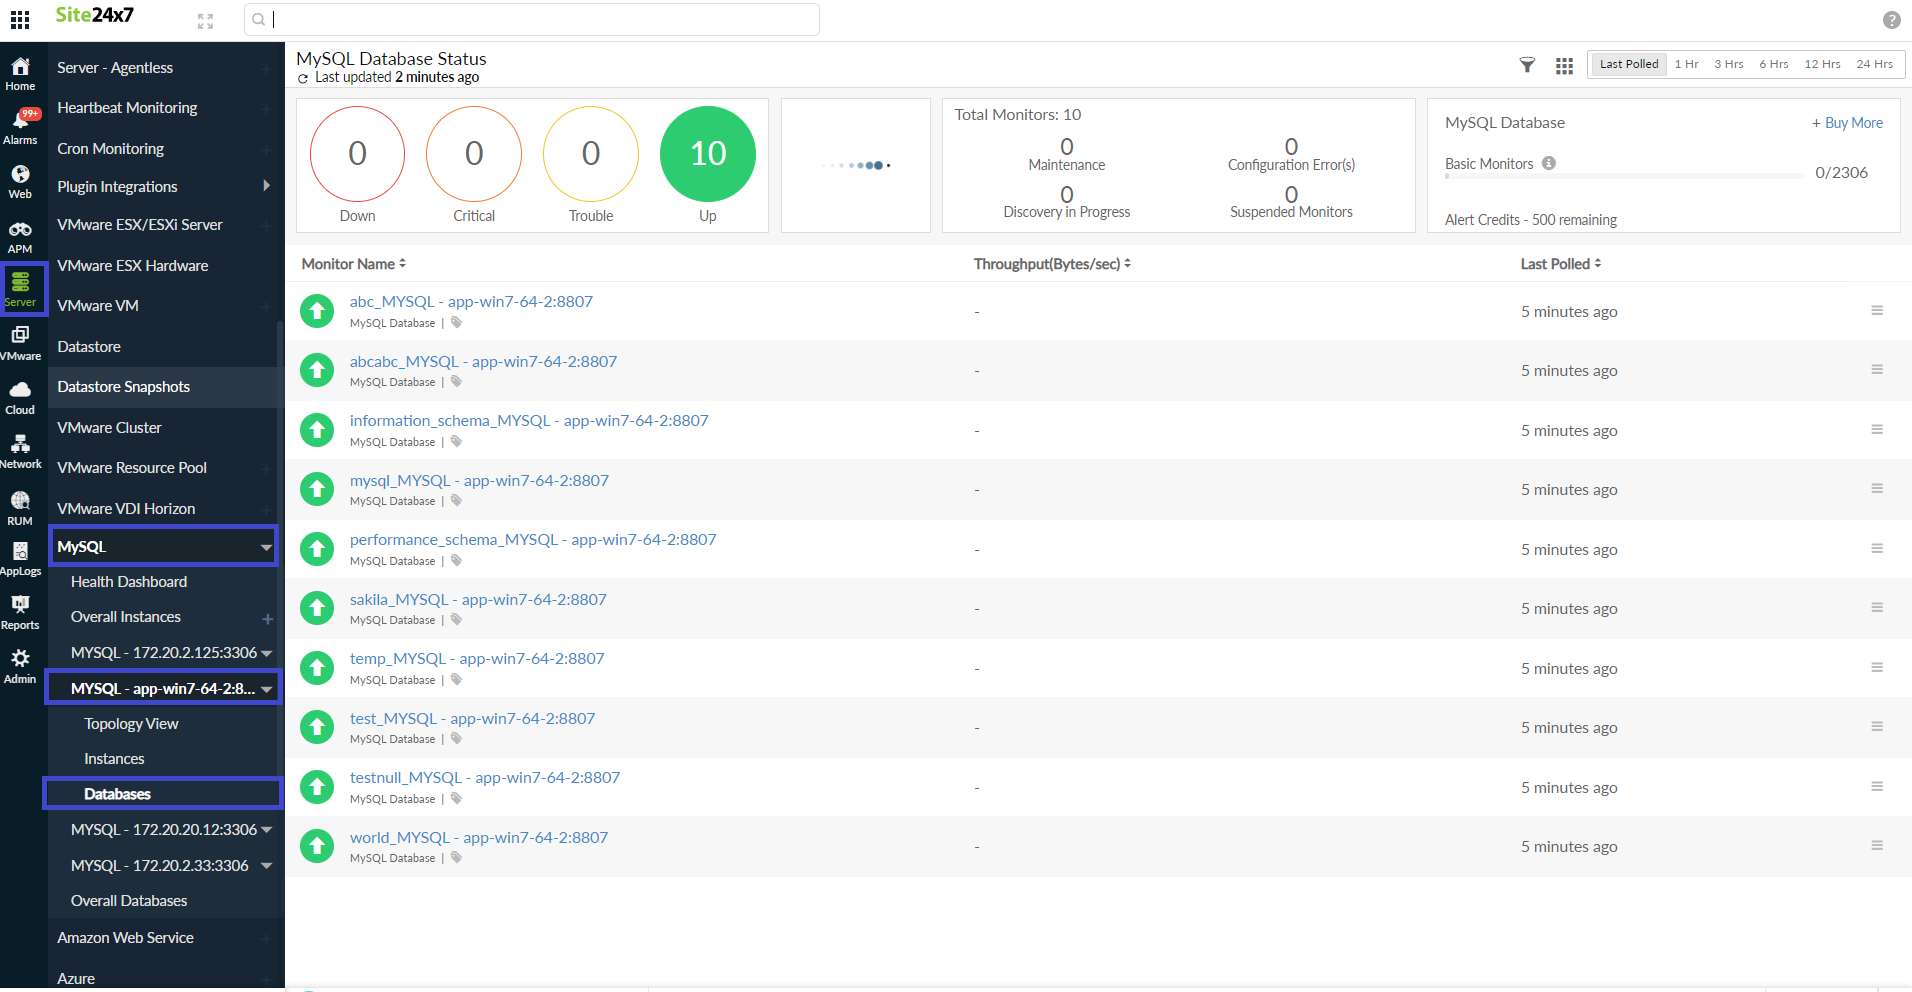
To view the list of the databases associated with a particular replication group, navigate to Server > MySQL and select the replication group listed under Overall Instances > Databases.
Reports
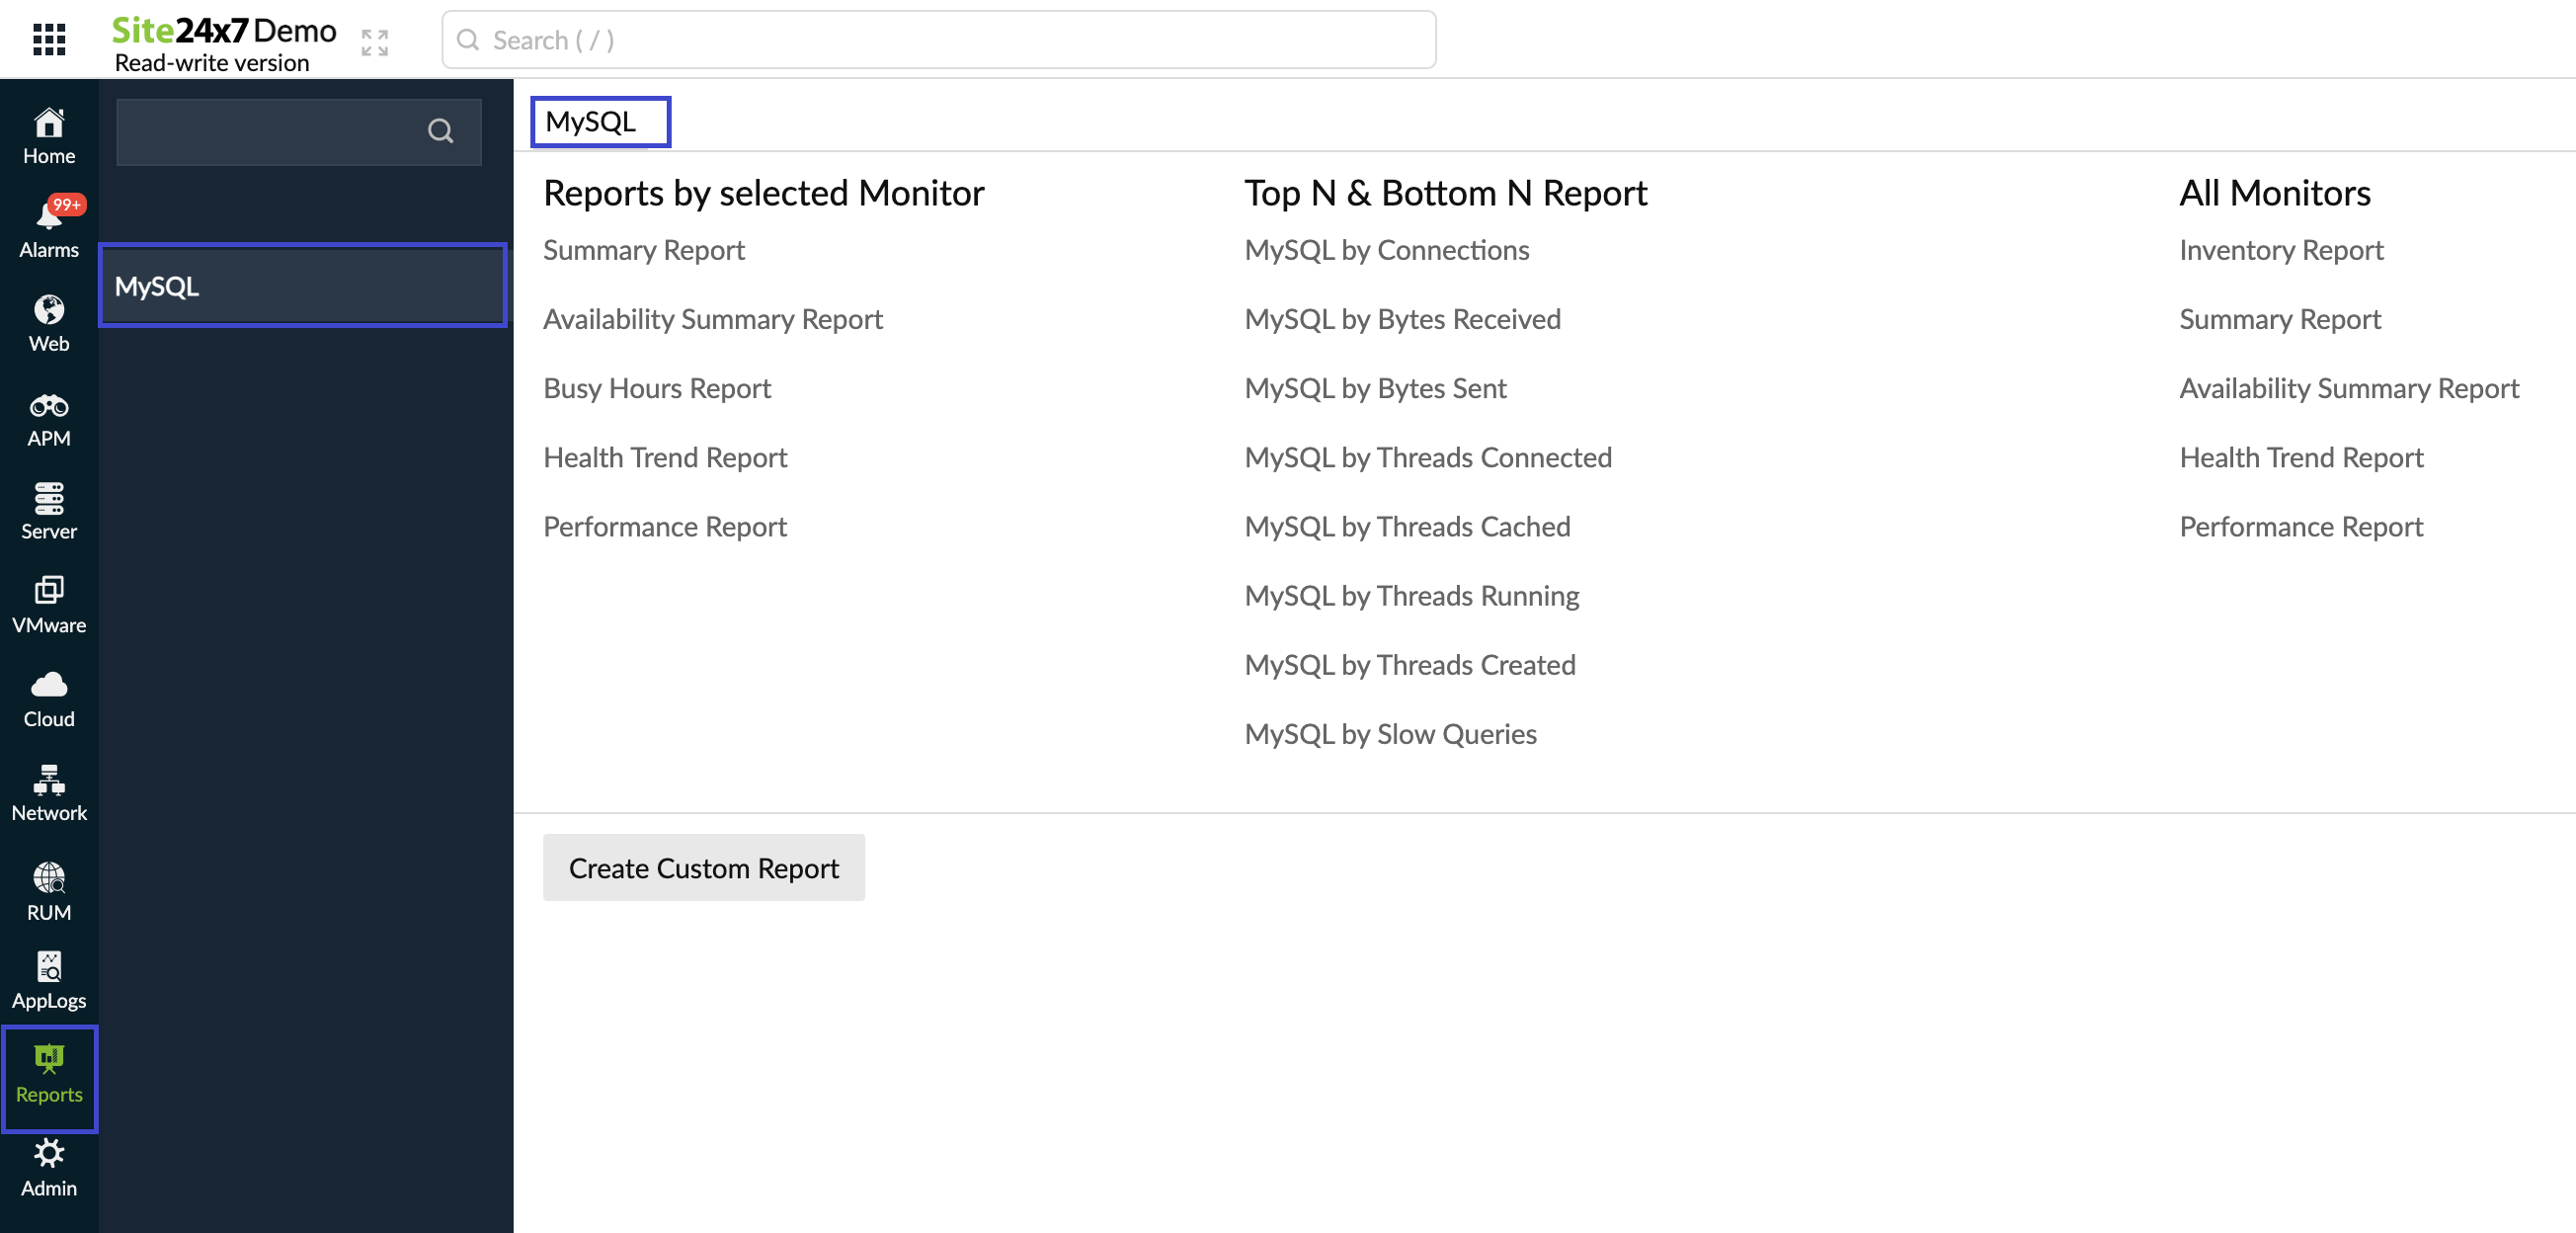
View the reports of your MySQL databases by clicking Reports > MySQL > report you want to view.
Licensing
Each MySQL Instance consumes one advanced monitor license and includes monitoring for twenty-five databases. For each additional database, one basic monitor license will be consumed.
FAQs on MySQL monitoring
- Why is my MySQL monitor not discovered?
- How to add/update the credentials of my MySQL database?
- My MySQL monitor shows "no data."
- I can only see a limited amount of MySQL database monitors added. How to add new databases for monitoring?
- Can I add all the databases in my MySQL server as monitors?
- It says, "Failed to register MySQL instance." How to troubleshoot?
- How to set thresholds for MySQL databases?
- How is MySQL added for monitoring in Site24x7?
- Other FAQs
